Jordanian vs Fijian Unemployment Among Ages 30 to 34 years
COMPARE
Jordanian
Fijian
Unemployment Among Ages 30 to 34 years
Unemployment Among Ages 30 to 34 years Comparison
Jordanians
Fijians
5.1%
UNEMPLOYMENT AMONG AGES 30 TO 34 YEARS
96.5/ 100
METRIC RATING
68th/ 347
METRIC RANK
5.0%
UNEMPLOYMENT AMONG AGES 30 TO 34 YEARS
99.0/ 100
METRIC RATING
39th/ 347
METRIC RANK
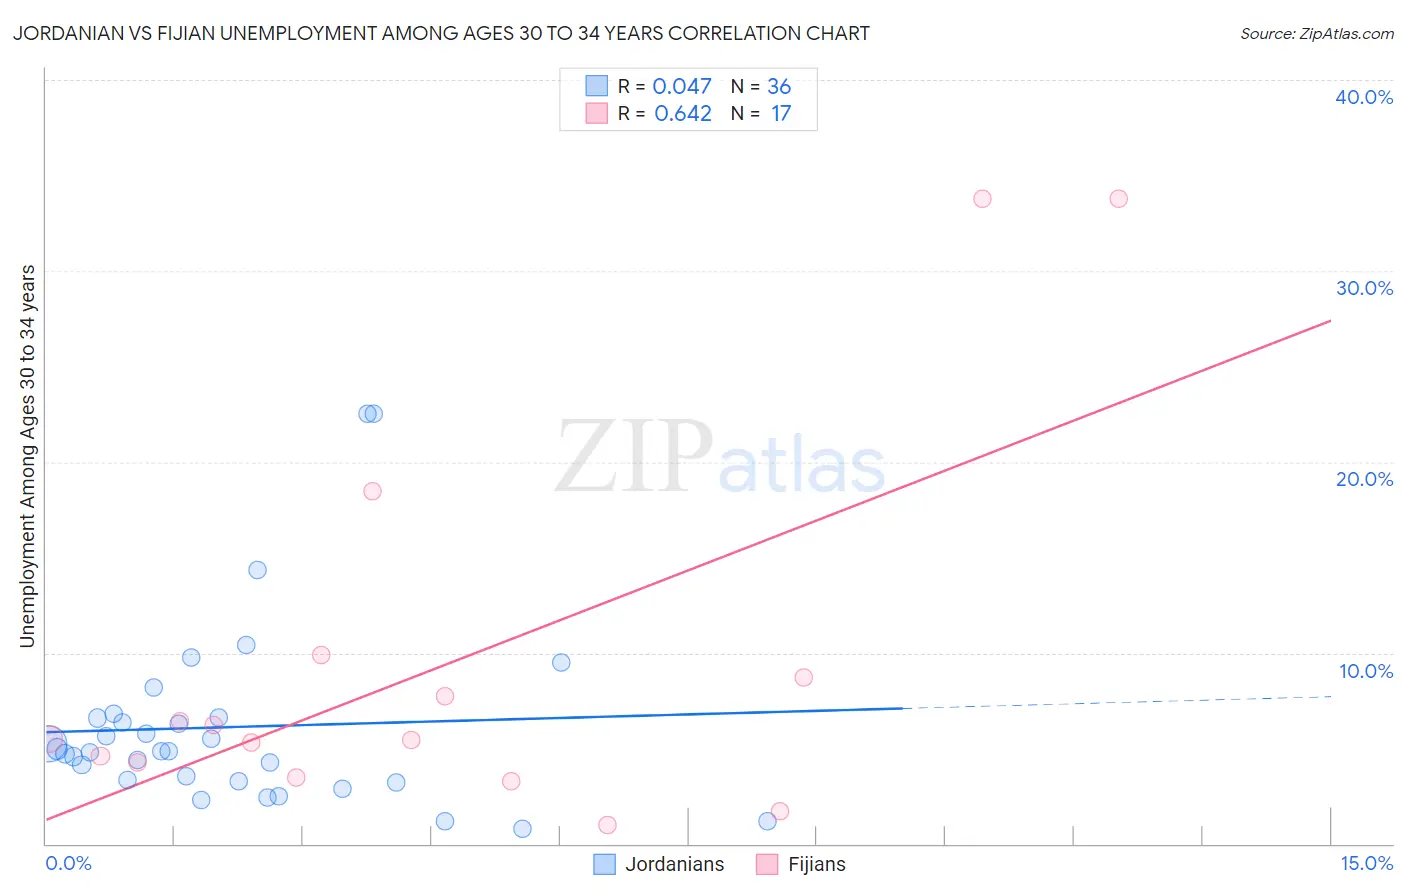
Jordanian vs Fijian Unemployment Among Ages 30 to 34 years Correlation Chart
The statistical analysis conducted on geographies consisting of 163,029,388 people shows no correlation between the proportion of Jordanians and unemployment rate among population between the ages 30 and 34 in the United States with a correlation coefficient (R) of 0.047 and weighted average of 5.1%. Similarly, the statistical analysis conducted on geographies consisting of 55,070,500 people shows a significant positive correlation between the proportion of Fijians and unemployment rate among population between the ages 30 and 34 in the United States with a correlation coefficient (R) of 0.642 and weighted average of 5.0%, a difference of 2.4%.
Unemployment Among Ages 30 to 34 years Correlation Summary
| Measurement | Jordanian | Fijian |
| Minimum | 0.80% | 1.0% |
| Maximum | 22.5% | 33.8% |
| Range | 21.7% | 32.8% |
| Mean | 6.1% | 9.4% |
| Median | 4.8% | 5.5% |
| Interquartile 25% (IQ1) | 3.3% | 3.8% |
| Interquartile 75% (IQ3) | 6.6% | 9.3% |
| Interquartile Range (IQR) | 3.3% | 5.5% |
| Standard Deviation (Sample) | 4.9% | 10.0% |
| Standard Deviation (Population) | 4.8% | 9.7% |
Similar Demographics by Unemployment Among Ages 30 to 34 years
Demographics Similar to Jordanians by Unemployment Among Ages 30 to 34 years
In terms of unemployment among ages 30 to 34 years, the demographic groups most similar to Jordanians are Burmese (5.1%, a difference of 0.010%), Immigrants from Northern Africa (5.1%, a difference of 0.010%), Immigrants from Iraq (5.1%, a difference of 0.010%), Paraguayan (5.1%, a difference of 0.020%), and Immigrants from Moldova (5.1%, a difference of 0.030%).
| Demographics | Rating | Rank | Unemployment Among Ages 30 to 34 years |
| Indians (Asian) | 97.0 /100 | #61 | Exceptional 5.1% |
| Immigrants | France | 97.0 /100 | #62 | Exceptional 5.1% |
| Belgians | 97.0 /100 | #63 | Exceptional 5.1% |
| Immigrants | Eastern Asia | 96.9 /100 | #64 | Exceptional 5.1% |
| Immigrants | Japan | 96.8 /100 | #65 | Exceptional 5.1% |
| Immigrants | Zimbabwe | 96.7 /100 | #66 | Exceptional 5.1% |
| Burmese | 96.5 /100 | #67 | Exceptional 5.1% |
| Jordanians | 96.5 /100 | #68 | Exceptional 5.1% |
| Immigrants | Northern Africa | 96.4 /100 | #69 | Exceptional 5.1% |
| Immigrants | Iraq | 96.4 /100 | #70 | Exceptional 5.1% |
| Paraguayans | 96.4 /100 | #71 | Exceptional 5.1% |
| Immigrants | Moldova | 96.4 /100 | #72 | Exceptional 5.1% |
| Slovenes | 96.2 /100 | #73 | Exceptional 5.2% |
| Immigrants | Asia | 96.2 /100 | #74 | Exceptional 5.2% |
| Iranians | 96.0 /100 | #75 | Exceptional 5.2% |
Demographics Similar to Fijians by Unemployment Among Ages 30 to 34 years
In terms of unemployment among ages 30 to 34 years, the demographic groups most similar to Fijians are Immigrants from Vietnam (5.0%, a difference of 0.080%), Immigrants from Eastern Africa (5.0%, a difference of 0.080%), Immigrants from Turkey (5.0%, a difference of 0.10%), Sri Lankan (5.0%, a difference of 0.10%), and Immigrants from Hong Kong (5.0%, a difference of 0.27%).
| Demographics | Rating | Rank | Unemployment Among Ages 30 to 34 years |
| Immigrants | Zaire | 99.3 /100 | #32 | Exceptional 5.0% |
| Immigrants | Saudi Arabia | 99.3 /100 | #33 | Exceptional 5.0% |
| Latvians | 99.3 /100 | #34 | Exceptional 5.0% |
| Immigrants | Ethiopia | 99.2 /100 | #35 | Exceptional 5.0% |
| Czechs | 99.2 /100 | #36 | Exceptional 5.0% |
| Immigrants | Turkey | 99.0 /100 | #37 | Exceptional 5.0% |
| Sri Lankans | 99.0 /100 | #38 | Exceptional 5.0% |
| Fijians | 99.0 /100 | #39 | Exceptional 5.0% |
| Immigrants | Vietnam | 98.9 /100 | #40 | Exceptional 5.0% |
| Immigrants | Eastern Africa | 98.9 /100 | #41 | Exceptional 5.0% |
| Immigrants | Hong Kong | 98.8 /100 | #42 | Exceptional 5.0% |
| Soviet Union | 98.8 /100 | #43 | Exceptional 5.0% |
| Immigrants | Belgium | 98.7 /100 | #44 | Exceptional 5.1% |
| Yugoslavians | 98.6 /100 | #45 | Exceptional 5.1% |
| Immigrants | Congo | 98.4 /100 | #46 | Exceptional 5.1% |