Immigrants from Liberia vs Venezuelan Unemployment Among Ages 45 to 54 years
COMPARE
Immigrants from Liberia
Venezuelan
Unemployment Among Ages 45 to 54 years
Unemployment Among Ages 45 to 54 years Comparison
Immigrants from Liberia
Venezuelans
4.8%
UNEMPLOYMENT AMONG AGES 45 TO 54 YEARS
0.8/ 100
METRIC RATING
248th/ 347
METRIC RANK
4.0%
UNEMPLOYMENT AMONG AGES 45 TO 54 YEARS
100.0/ 100
METRIC RATING
10th/ 347
METRIC RANK
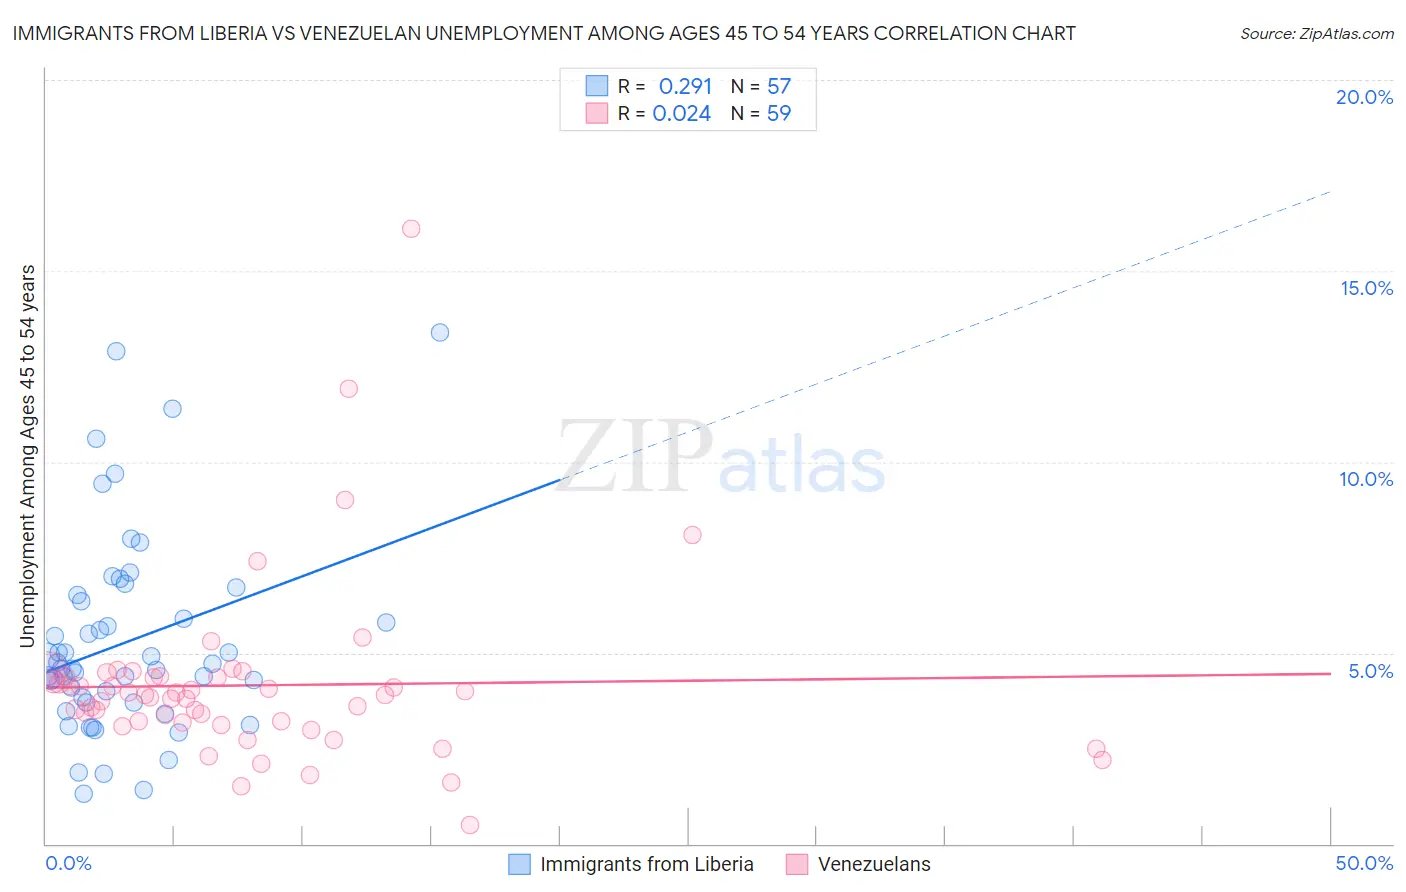
Immigrants from Liberia vs Venezuelan Unemployment Among Ages 45 to 54 years Correlation Chart
The statistical analysis conducted on geographies consisting of 134,368,611 people shows a weak positive correlation between the proportion of Immigrants from Liberia and unemployment rate among population between the ages 45 and 54 in the United States with a correlation coefficient (R) of 0.291 and weighted average of 4.8%. Similarly, the statistical analysis conducted on geographies consisting of 301,674,549 people shows no correlation between the proportion of Venezuelans and unemployment rate among population between the ages 45 and 54 in the United States with a correlation coefficient (R) of 0.024 and weighted average of 4.0%, a difference of 19.6%.
Unemployment Among Ages 45 to 54 years Correlation Summary
| Measurement | Immigrants from Liberia | Venezuelan |
| Minimum | 1.3% | 0.50% |
| Maximum | 13.4% | 16.1% |
| Range | 12.1% | 15.6% |
| Mean | 5.3% | 4.1% |
| Median | 4.6% | 3.9% |
| Interquartile 25% (IQ1) | 3.7% | 3.2% |
| Interquartile 75% (IQ3) | 6.4% | 4.4% |
| Interquartile Range (IQR) | 2.7% | 1.2% |
| Standard Deviation (Sample) | 2.6% | 2.4% |
| Standard Deviation (Population) | 2.6% | 2.3% |
Similar Demographics by Unemployment Among Ages 45 to 54 years
Demographics Similar to Immigrants from Liberia by Unemployment Among Ages 45 to 54 years
In terms of unemployment among ages 45 to 54 years, the demographic groups most similar to Immigrants from Liberia are Israeli (4.8%, a difference of 0.11%), Immigrants from Syria (4.8%, a difference of 0.16%), Immigrants from Albania (4.8%, a difference of 0.17%), Immigrants from Honduras (4.8%, a difference of 0.17%), and Salvadoran (4.8%, a difference of 0.24%).
| Demographics | Rating | Rank | Unemployment Among Ages 45 to 54 years |
| Delaware | 1.3 /100 | #241 | Tragic 4.8% |
| Central Americans | 1.3 /100 | #242 | Tragic 4.8% |
| Portuguese | 1.1 /100 | #243 | Tragic 4.8% |
| Seminole | 1.1 /100 | #244 | Tragic 4.8% |
| Immigrants | Albania | 0.9 /100 | #245 | Tragic 4.8% |
| Immigrants | Syria | 0.9 /100 | #246 | Tragic 4.8% |
| Israelis | 0.9 /100 | #247 | Tragic 4.8% |
| Immigrants | Liberia | 0.8 /100 | #248 | Tragic 4.8% |
| Immigrants | Honduras | 0.7 /100 | #249 | Tragic 4.8% |
| Salvadorans | 0.7 /100 | #250 | Tragic 4.8% |
| Hondurans | 0.4 /100 | #251 | Tragic 4.8% |
| Immigrants | Bahamas | 0.3 /100 | #252 | Tragic 4.8% |
| Moroccans | 0.3 /100 | #253 | Tragic 4.8% |
| Immigrants | Lebanon | 0.2 /100 | #254 | Tragic 4.8% |
| Immigrants | El Salvador | 0.2 /100 | #255 | Tragic 4.8% |
Demographics Similar to Venezuelans by Unemployment Among Ages 45 to 54 years
In terms of unemployment among ages 45 to 54 years, the demographic groups most similar to Venezuelans are Scandinavian (4.0%, a difference of 0.14%), Swedish (4.0%, a difference of 0.15%), Cuban (4.0%, a difference of 0.30%), Immigrants from Bosnia and Herzegovina (4.0%, a difference of 0.35%), and Czech (4.0%, a difference of 0.62%).
| Demographics | Rating | Rank | Unemployment Among Ages 45 to 54 years |
| Norwegians | 100.0 /100 | #3 | Exceptional 3.9% |
| Immigrants | India | 100.0 /100 | #4 | Exceptional 3.9% |
| Danes | 100.0 /100 | #5 | Exceptional 3.9% |
| Immigrants | Cuba | 100.0 /100 | #6 | Exceptional 3.9% |
| Immigrants | Venezuela | 100.0 /100 | #7 | Exceptional 3.9% |
| Chinese | 100.0 /100 | #8 | Exceptional 4.0% |
| Czechs | 100.0 /100 | #9 | Exceptional 4.0% |
| Venezuelans | 100.0 /100 | #10 | Exceptional 4.0% |
| Scandinavians | 100.0 /100 | #11 | Exceptional 4.0% |
| Swedes | 100.0 /100 | #12 | Exceptional 4.0% |
| Cubans | 100.0 /100 | #13 | Exceptional 4.0% |
| Immigrants | Bosnia and Herzegovina | 100.0 /100 | #14 | Exceptional 4.0% |
| Immigrants | Bolivia | 100.0 /100 | #15 | Exceptional 4.0% |
| Thais | 100.0 /100 | #16 | Exceptional 4.0% |
| Tongans | 100.0 /100 | #17 | Exceptional 4.1% |