Immigrants from Moldova vs Venezuelan Unemployment Among Ages 45 to 54 years
COMPARE
Immigrants from Moldova
Venezuelan
Unemployment Among Ages 45 to 54 years
Unemployment Among Ages 45 to 54 years Comparison
Immigrants from Moldova
Venezuelans
4.1%
UNEMPLOYMENT AMONG AGES 45 TO 54 YEARS
99.9/ 100
METRIC RATING
27th/ 347
METRIC RANK
4.0%
UNEMPLOYMENT AMONG AGES 45 TO 54 YEARS
100.0/ 100
METRIC RATING
10th/ 347
METRIC RANK
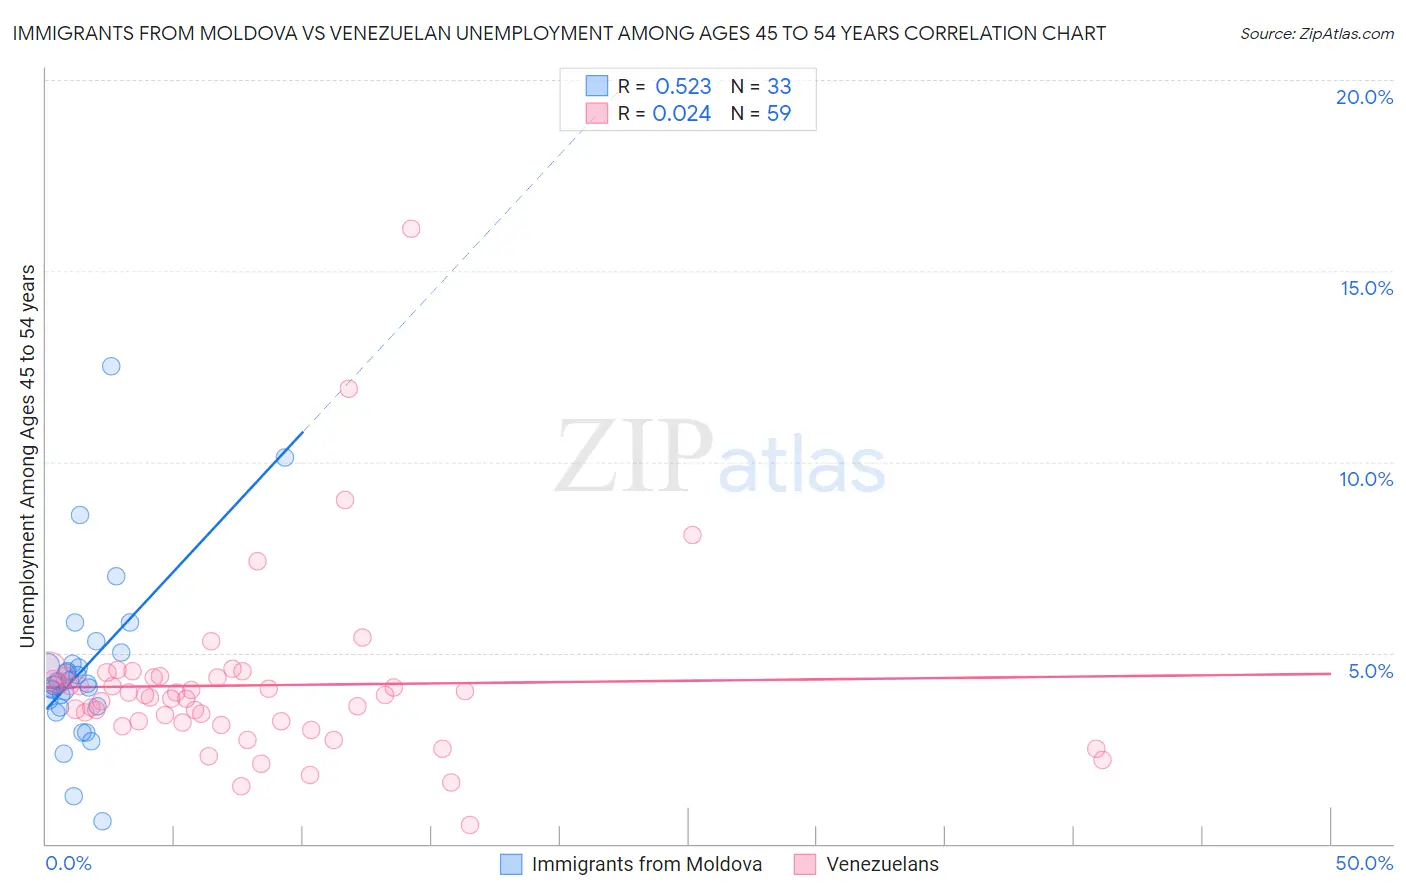
Immigrants from Moldova vs Venezuelan Unemployment Among Ages 45 to 54 years Correlation Chart
The statistical analysis conducted on geographies consisting of 123,406,606 people shows a substantial positive correlation between the proportion of Immigrants from Moldova and unemployment rate among population between the ages 45 and 54 in the United States with a correlation coefficient (R) of 0.523 and weighted average of 4.1%. Similarly, the statistical analysis conducted on geographies consisting of 301,674,549 people shows no correlation between the proportion of Venezuelans and unemployment rate among population between the ages 45 and 54 in the United States with a correlation coefficient (R) of 0.024 and weighted average of 4.0%, a difference of 3.7%.
Unemployment Among Ages 45 to 54 years Correlation Summary
| Measurement | Immigrants from Moldova | Venezuelan |
| Minimum | 0.60% | 0.50% |
| Maximum | 12.5% | 16.1% |
| Range | 11.9% | 15.6% |
| Mean | 4.6% | 4.1% |
| Median | 4.2% | 3.9% |
| Interquartile 25% (IQ1) | 3.6% | 3.2% |
| Interquartile 75% (IQ3) | 4.9% | 4.4% |
| Interquartile Range (IQR) | 1.3% | 1.2% |
| Standard Deviation (Sample) | 2.3% | 2.4% |
| Standard Deviation (Population) | 2.2% | 2.3% |
Demographics Similar to Immigrants from Moldova and Venezuelans by Unemployment Among Ages 45 to 54 years
In terms of unemployment among ages 45 to 54 years, the demographic groups most similar to Immigrants from Moldova are Welsh (4.1%, a difference of 0.070%), Bolivian (4.1%, a difference of 0.48%), Scottish (4.1%, a difference of 0.48%), Carpatho Rusyn (4.1%, a difference of 0.60%), and Bulgarian (4.1%, a difference of 1.3%). Similarly, the demographic groups most similar to Venezuelans are Scandinavian (4.0%, a difference of 0.14%), Swedish (4.0%, a difference of 0.15%), Cuban (4.0%, a difference of 0.30%), Immigrants from Bosnia and Herzegovina (4.0%, a difference of 0.35%), and Czech (4.0%, a difference of 0.62%).
| Demographics | Rating | Rank | Unemployment Among Ages 45 to 54 years |
| Chinese | 100.0 /100 | #8 | Exceptional 4.0% |
| Czechs | 100.0 /100 | #9 | Exceptional 4.0% |
| Venezuelans | 100.0 /100 | #10 | Exceptional 4.0% |
| Scandinavians | 100.0 /100 | #11 | Exceptional 4.0% |
| Swedes | 100.0 /100 | #12 | Exceptional 4.0% |
| Cubans | 100.0 /100 | #13 | Exceptional 4.0% |
| Immigrants | Bosnia and Herzegovina | 100.0 /100 | #14 | Exceptional 4.0% |
| Immigrants | Bolivia | 100.0 /100 | #15 | Exceptional 4.0% |
| Thais | 100.0 /100 | #16 | Exceptional 4.0% |
| Tongans | 100.0 /100 | #17 | Exceptional 4.1% |
| Germans | 100.0 /100 | #18 | Exceptional 4.1% |
| Swiss | 100.0 /100 | #19 | Exceptional 4.1% |
| English | 100.0 /100 | #20 | Exceptional 4.1% |
| Europeans | 100.0 /100 | #21 | Exceptional 4.1% |
| Yugoslavians | 100.0 /100 | #22 | Exceptional 4.1% |
| Bulgarians | 100.0 /100 | #23 | Exceptional 4.1% |
| Carpatho Rusyns | 100.0 /100 | #24 | Exceptional 4.1% |
| Bolivians | 99.9 /100 | #25 | Exceptional 4.1% |
| Scottish | 99.9 /100 | #26 | Exceptional 4.1% |
| Immigrants | Moldova | 99.9 /100 | #27 | Exceptional 4.1% |
| Welsh | 99.9 /100 | #28 | Exceptional 4.1% |