Immigrants from Eastern Asia vs German Russian Unemployment Among Women with Children Under 6 years
COMPARE
Immigrants from Eastern Asia
German Russian
Unemployment Among Women with Children Under 6 years
Unemployment Among Women with Children Under 6 years Comparison
Immigrants from Eastern Asia
German Russians
6.3%
UNEMPLOYMENT AMONG WOMEN WITH CHILDREN UNDER 6 YEARS
100.0/ 100
METRIC RATING
13th/ 347
METRIC RANK
8.2%
UNEMPLOYMENT AMONG WOMEN WITH CHILDREN UNDER 6 YEARS
1.2/ 100
METRIC RATING
247th/ 347
METRIC RANK
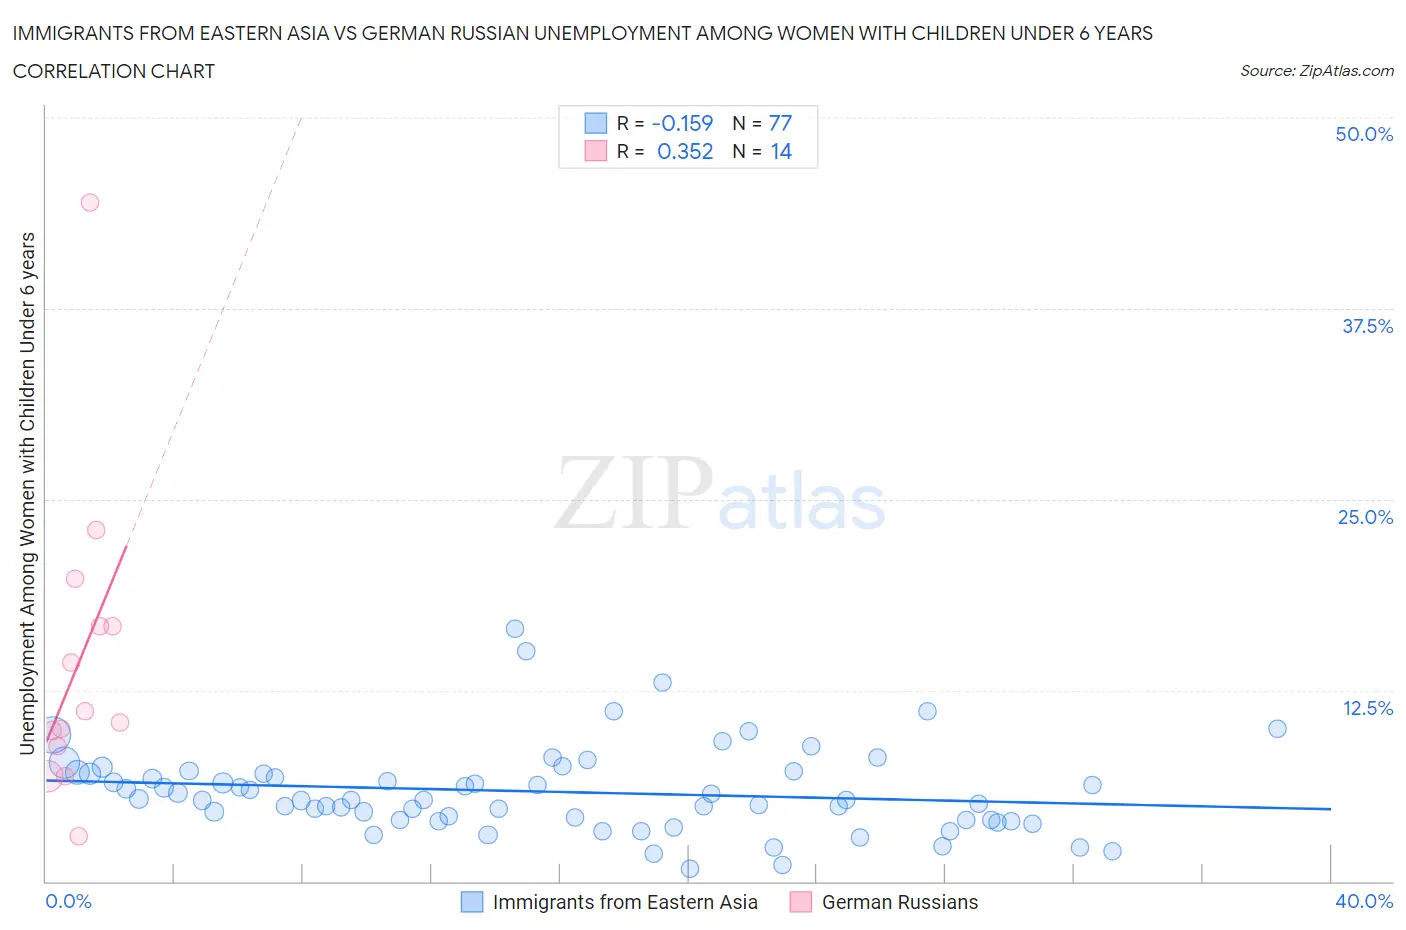
Immigrants from Eastern Asia vs German Russian Unemployment Among Women with Children Under 6 years Correlation Chart
The statistical analysis conducted on geographies consisting of 354,997,962 people shows a poor negative correlation between the proportion of Immigrants from Eastern Asia and unemployment rate among women with children under the age of 6 in the United States with a correlation coefficient (R) of -0.159 and weighted average of 6.3%. Similarly, the statistical analysis conducted on geographies consisting of 86,977,720 people shows a mild positive correlation between the proportion of German Russians and unemployment rate among women with children under the age of 6 in the United States with a correlation coefficient (R) of 0.352 and weighted average of 8.2%, a difference of 30.2%.
Unemployment Among Women with Children Under 6 years Correlation Summary
| Measurement | Immigrants from Eastern Asia | German Russian |
| Minimum | 0.80% | 2.9% |
| Maximum | 16.5% | 44.5% |
| Range | 15.7% | 41.5% |
| Mean | 5.9% | 14.4% |
| Median | 5.3% | 10.8% |
| Interquartile 25% (IQ1) | 4.0% | 8.9% |
| Interquartile 75% (IQ3) | 7.1% | 16.7% |
| Interquartile Range (IQR) | 3.1% | 7.8% |
| Standard Deviation (Sample) | 2.9% | 10.2% |
| Standard Deviation (Population) | 2.8% | 9.9% |
Similar Demographics by Unemployment Among Women with Children Under 6 years
Demographics Similar to Immigrants from Eastern Asia by Unemployment Among Women with Children Under 6 years
In terms of unemployment among women with children under 6 years, the demographic groups most similar to Immigrants from Eastern Asia are Immigrants from Singapore (6.3%, a difference of 0.050%), Indian (Asian) (6.3%, a difference of 0.070%), Immigrants from Bulgaria (6.3%, a difference of 0.32%), Thai (6.3%, a difference of 0.42%), and Immigrants from Uzbekistan (6.3%, a difference of 0.72%).
| Demographics | Rating | Rank | Unemployment Among Women with Children Under 6 years |
| Immigrants | Taiwan | 100.0 /100 | #6 | Exceptional 6.0% |
| Taiwanese | 100.0 /100 | #7 | Exceptional 6.1% |
| Immigrants | India | 100.0 /100 | #8 | Exceptional 6.1% |
| Filipinos | 100.0 /100 | #9 | Exceptional 6.1% |
| Immigrants | China | 100.0 /100 | #10 | Exceptional 6.2% |
| Indians (Asian) | 100.0 /100 | #11 | Exceptional 6.3% |
| Immigrants | Singapore | 100.0 /100 | #12 | Exceptional 6.3% |
| Immigrants | Eastern Asia | 100.0 /100 | #13 | Exceptional 6.3% |
| Immigrants | Bulgaria | 100.0 /100 | #14 | Exceptional 6.3% |
| Thais | 100.0 /100 | #15 | Exceptional 6.3% |
| Immigrants | Uzbekistan | 100.0 /100 | #16 | Exceptional 6.3% |
| Immigrants | Malaysia | 100.0 /100 | #17 | Exceptional 6.4% |
| Assyrians/Chaldeans/Syriacs | 100.0 /100 | #18 | Exceptional 6.5% |
| Mongolians | 100.0 /100 | #19 | Exceptional 6.5% |
| Ute | 100.0 /100 | #20 | Exceptional 6.5% |
Demographics Similar to German Russians by Unemployment Among Women with Children Under 6 years
In terms of unemployment among women with children under 6 years, the demographic groups most similar to German Russians are Immigrants from Western Africa (8.2%, a difference of 0.040%), Immigrants from Sierra Leone (8.2%, a difference of 0.13%), Nigerian (8.2%, a difference of 0.14%), Central American (8.2%, a difference of 0.28%), and Guyanese (8.2%, a difference of 0.31%).
| Demographics | Rating | Rank | Unemployment Among Women with Children Under 6 years |
| Immigrants | El Salvador | 2.6 /100 | #240 | Tragic 8.1% |
| Liberians | 2.6 /100 | #241 | Tragic 8.1% |
| Dutch | 2.5 /100 | #242 | Tragic 8.1% |
| Hawaiians | 1.8 /100 | #243 | Tragic 8.2% |
| French | 1.7 /100 | #244 | Tragic 8.2% |
| Native Hawaiians | 1.7 /100 | #245 | Tragic 8.2% |
| Central Americans | 1.4 /100 | #246 | Tragic 8.2% |
| German Russians | 1.2 /100 | #247 | Tragic 8.2% |
| Immigrants | Western Africa | 1.1 /100 | #248 | Tragic 8.2% |
| Immigrants | Sierra Leone | 1.1 /100 | #249 | Tragic 8.2% |
| Nigerians | 1.1 /100 | #250 | Tragic 8.2% |
| Guyanese | 1.0 /100 | #251 | Tragic 8.2% |
| Ghanaians | 1.0 /100 | #252 | Tragic 8.2% |
| Immigrants | Guyana | 0.8 /100 | #253 | Tragic 8.2% |
| Immigrants | Caribbean | 0.7 /100 | #254 | Tragic 8.3% |