Immigrants from Lebanon vs Native/Alaskan 4th Grade
COMPARE
Immigrants from Lebanon
Native/Alaskan
4th Grade
4th Grade Comparison
Immigrants from Lebanon
Natives/Alaskans
97.3%
4TH GRADE
5.1/ 100
METRIC RATING
222nd/ 347
METRIC RANK
97.4%
4TH GRADE
20.6/ 100
METRIC RATING
199th/ 347
METRIC RANK
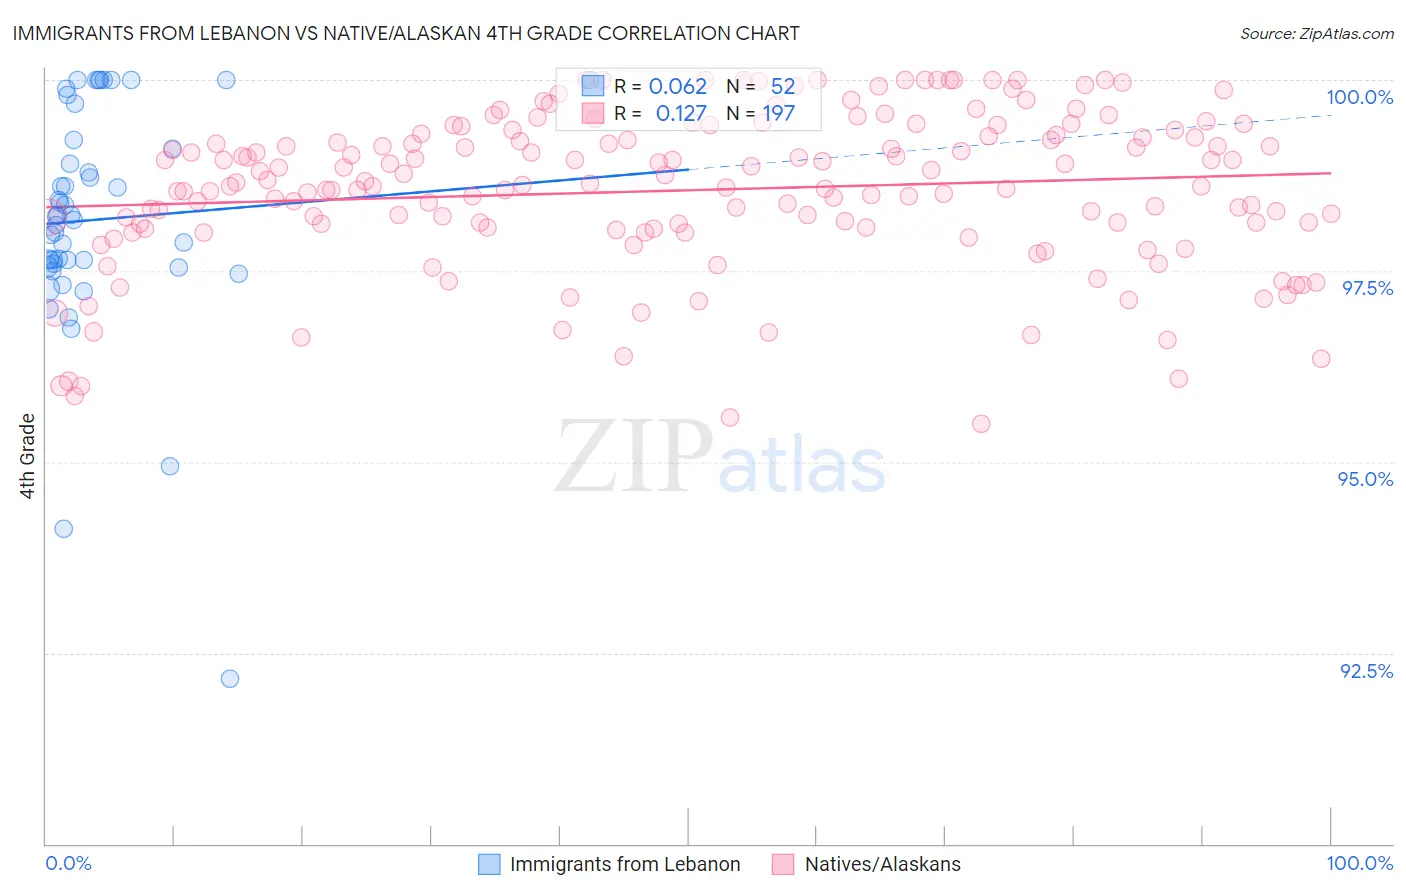
Immigrants from Lebanon vs Native/Alaskan 4th Grade Correlation Chart
The statistical analysis conducted on geographies consisting of 217,155,328 people shows a slight positive correlation between the proportion of Immigrants from Lebanon and percentage of population with at least 4th grade education in the United States with a correlation coefficient (R) of 0.062 and weighted average of 97.3%. Similarly, the statistical analysis conducted on geographies consisting of 513,056,654 people shows a poor positive correlation between the proportion of Natives/Alaskans and percentage of population with at least 4th grade education in the United States with a correlation coefficient (R) of 0.127 and weighted average of 97.4%, a difference of 0.15%.
4th Grade Correlation Summary
| Measurement | Immigrants from Lebanon | Native/Alaskan |
| Minimum | 92.2% | 95.5% |
| Maximum | 100.0% | 100.0% |
| Range | 7.8% | 4.5% |
| Mean | 98.2% | 98.6% |
| Median | 98.2% | 98.6% |
| Interquartile 25% (IQ1) | 97.6% | 98.1% |
| Interquartile 75% (IQ3) | 99.2% | 99.3% |
| Interquartile Range (IQR) | 1.6% | 1.2% |
| Standard Deviation (Sample) | 1.5% | 1.0% |
| Standard Deviation (Population) | 1.5% | 1.0% |
Similar Demographics by 4th Grade
Demographics Similar to Immigrants from Lebanon by 4th Grade
In terms of 4th grade, the demographic groups most similar to Immigrants from Lebanon are Immigrants from Sudan (97.2%, a difference of 0.0%), Immigrants from Syria (97.2%, a difference of 0.0%), Tongan (97.3%, a difference of 0.010%), South American Indian (97.3%, a difference of 0.010%), and Immigrants from Panama (97.3%, a difference of 0.010%).
| Demographics | Rating | Rank | 4th Grade |
| Immigrants | Morocco | 7.1 /100 | #215 | Tragic 97.3% |
| Samoans | 6.8 /100 | #216 | Tragic 97.3% |
| Sierra Leoneans | 6.5 /100 | #217 | Tragic 97.3% |
| Iraqis | 6.3 /100 | #218 | Tragic 97.3% |
| Tongans | 5.8 /100 | #219 | Tragic 97.3% |
| South American Indians | 5.5 /100 | #220 | Tragic 97.3% |
| Immigrants | Panama | 5.4 /100 | #221 | Tragic 97.3% |
| Immigrants | Lebanon | 5.1 /100 | #222 | Tragic 97.3% |
| Immigrants | Sudan | 5.0 /100 | #223 | Tragic 97.2% |
| Immigrants | Syria | 5.0 /100 | #224 | Tragic 97.2% |
| Immigrants | Iraq | 4.6 /100 | #225 | Tragic 97.2% |
| Bahamians | 3.8 /100 | #226 | Tragic 97.2% |
| Immigrants | Pakistan | 3.7 /100 | #227 | Tragic 97.2% |
| Sub-Saharan Africans | 3.6 /100 | #228 | Tragic 97.2% |
| Liberians | 3.6 /100 | #229 | Tragic 97.2% |
Demographics Similar to Natives/Alaskans by 4th Grade
In terms of 4th grade, the demographic groups most similar to Natives/Alaskans are Guamanian/Chamorro (97.4%, a difference of 0.010%), Immigrants from Uganda (97.4%, a difference of 0.010%), Hawaiian (97.4%, a difference of 0.030%), Immigrants from Southern Europe (97.4%, a difference of 0.030%), and Immigrants from Chile (97.4%, a difference of 0.030%).
| Demographics | Rating | Rank | 4th Grade |
| Immigrants | Ukraine | 30.1 /100 | #192 | Fair 97.4% |
| Immigrants | Egypt | 30.1 /100 | #193 | Fair 97.4% |
| Portuguese | 29.2 /100 | #194 | Fair 97.4% |
| Paraguayans | 28.9 /100 | #195 | Fair 97.4% |
| Immigrants | Albania | 27.7 /100 | #196 | Fair 97.4% |
| Hawaiians | 25.6 /100 | #197 | Fair 97.4% |
| Guamanians/Chamorros | 23.0 /100 | #198 | Fair 97.4% |
| Natives/Alaskans | 20.6 /100 | #199 | Fair 97.4% |
| Immigrants | Uganda | 19.8 /100 | #200 | Poor 97.4% |
| Immigrants | Southern Europe | 16.2 /100 | #201 | Poor 97.4% |
| Immigrants | Chile | 16.1 /100 | #202 | Poor 97.4% |
| Immigrants | Northern Africa | 15.1 /100 | #203 | Poor 97.4% |
| Africans | 14.6 /100 | #204 | Poor 97.4% |
| Paiute | 13.2 /100 | #205 | Poor 97.3% |
| Immigrants | Zaire | 12.8 /100 | #206 | Poor 97.3% |