Immigrants from Lebanon vs Argentinean Unemployment Among Women with Children Under 18 years
COMPARE
Immigrants from Lebanon
Argentinean
Unemployment Among Women with Children Under 18 years
Unemployment Among Women with Children Under 18 years Comparison
Immigrants from Lebanon
Argentineans
5.8%
UNEMPLOYMENT AMONG WOMEN WITH CHILDREN UNDER 18 YEARS
2.4/ 100
METRIC RATING
237th/ 347
METRIC RANK
5.3%
UNEMPLOYMENT AMONG WOMEN WITH CHILDREN UNDER 18 YEARS
78.8/ 100
METRIC RATING
138th/ 347
METRIC RANK
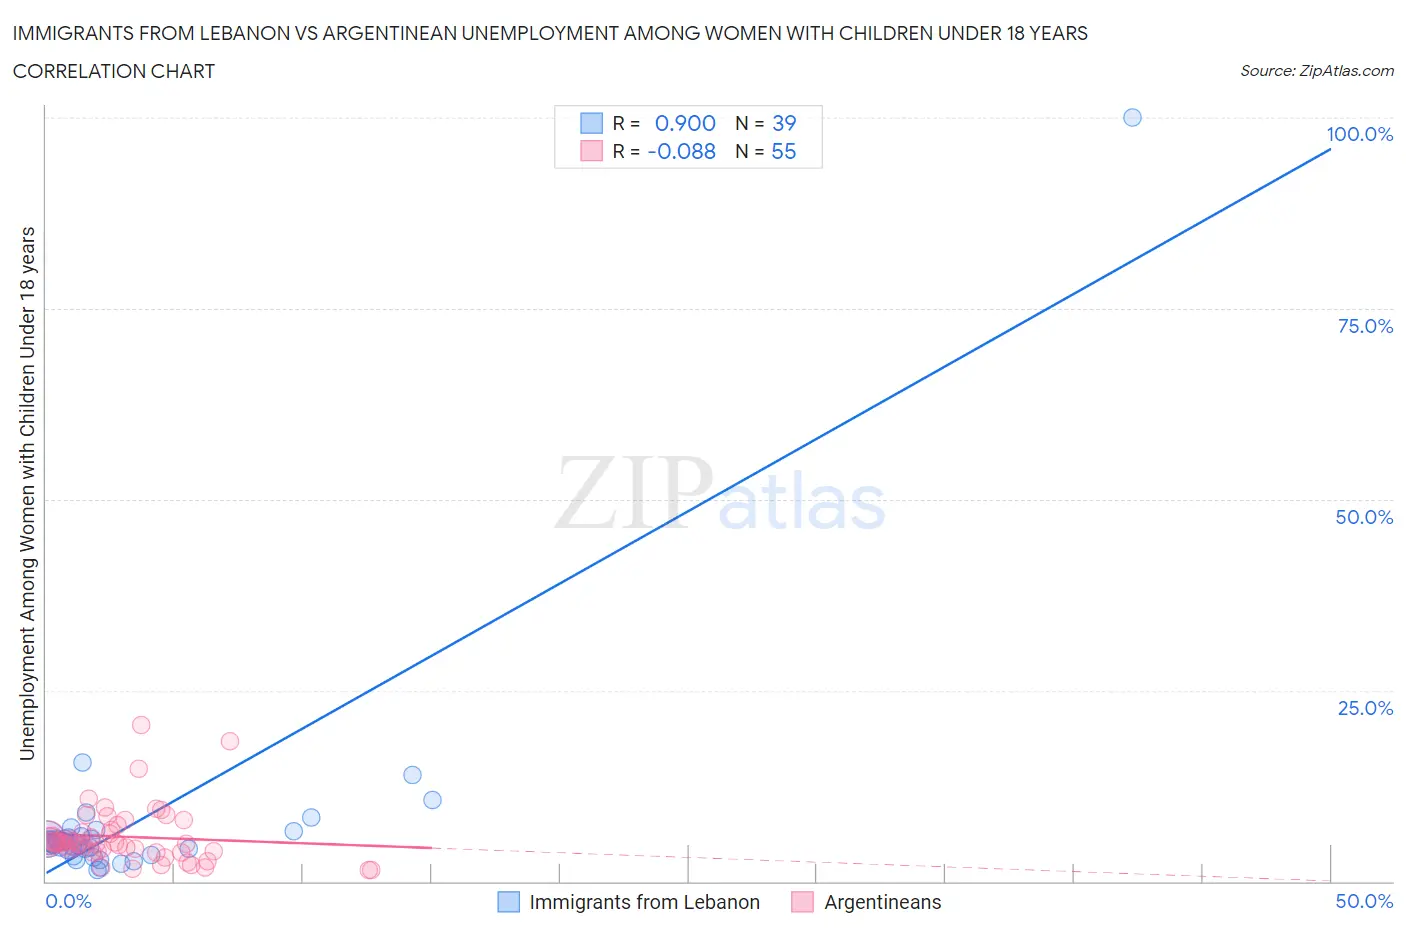
Immigrants from Lebanon vs Argentinean Unemployment Among Women with Children Under 18 years Correlation Chart
The statistical analysis conducted on geographies consisting of 213,501,801 people shows a very strong positive correlation between the proportion of Immigrants from Lebanon and unemployment rate among women with children under the age of 18 in the United States with a correlation coefficient (R) of 0.900 and weighted average of 5.8%. Similarly, the statistical analysis conducted on geographies consisting of 290,077,964 people shows a slight negative correlation between the proportion of Argentineans and unemployment rate among women with children under the age of 18 in the United States with a correlation coefficient (R) of -0.088 and weighted average of 5.3%, a difference of 9.1%.
Unemployment Among Women with Children Under 18 years Correlation Summary
| Measurement | Immigrants from Lebanon | Argentinean |
| Minimum | 1.4% | 1.4% |
| Maximum | 100.0% | 20.5% |
| Range | 98.6% | 19.1% |
| Mean | 7.9% | 5.8% |
| Median | 5.0% | 5.0% |
| Interquartile 25% (IQ1) | 4.2% | 3.9% |
| Interquartile 75% (IQ3) | 5.9% | 6.7% |
| Interquartile Range (IQR) | 1.7% | 2.8% |
| Standard Deviation (Sample) | 15.4% | 3.7% |
| Standard Deviation (Population) | 15.2% | 3.7% |
Similar Demographics by Unemployment Among Women with Children Under 18 years
Demographics Similar to Immigrants from Lebanon by Unemployment Among Women with Children Under 18 years
In terms of unemployment among women with children under 18 years, the demographic groups most similar to Immigrants from Lebanon are Alsatian (5.8%, a difference of 0.10%), Immigrants from Somalia (5.8%, a difference of 0.19%), Immigrants from Middle Africa (5.8%, a difference of 0.27%), Immigrants from Sierra Leone (5.8%, a difference of 0.27%), and Immigrants (5.8%, a difference of 0.27%).
| Demographics | Rating | Rank | Unemployment Among Women with Children Under 18 years |
| Immigrants | South America | 3.2 /100 | #230 | Tragic 5.8% |
| Immigrants | Africa | 3.1 /100 | #231 | Tragic 5.8% |
| Creek | 3.1 /100 | #232 | Tragic 5.8% |
| Spanish Americans | 3.1 /100 | #233 | Tragic 5.8% |
| Guamanians/Chamorros | 2.9 /100 | #234 | Tragic 5.8% |
| Immigrants | Middle Africa | 2.8 /100 | #235 | Tragic 5.8% |
| Alsatians | 2.5 /100 | #236 | Tragic 5.8% |
| Immigrants | Lebanon | 2.4 /100 | #237 | Tragic 5.8% |
| Immigrants | Somalia | 2.2 /100 | #238 | Tragic 5.8% |
| Immigrants | Sierra Leone | 2.0 /100 | #239 | Tragic 5.8% |
| Immigrants | Immigrants | 2.0 /100 | #240 | Tragic 5.8% |
| Brazilians | 1.6 /100 | #241 | Tragic 5.8% |
| Moroccans | 1.4 /100 | #242 | Tragic 5.9% |
| Immigrants | Uruguay | 1.1 /100 | #243 | Tragic 5.9% |
| Choctaw | 1.1 /100 | #244 | Tragic 5.9% |
Demographics Similar to Argentineans by Unemployment Among Women with Children Under 18 years
In terms of unemployment among women with children under 18 years, the demographic groups most similar to Argentineans are Jordanian (5.3%, a difference of 0.010%), Immigrants from Ukraine (5.3%, a difference of 0.030%), Immigrants from Jordan (5.3%, a difference of 0.080%), New Zealander (5.3%, a difference of 0.13%), and Slovak (5.3%, a difference of 0.19%).
| Demographics | Rating | Rank | Unemployment Among Women with Children Under 18 years |
| Immigrants | Israel | 81.9 /100 | #131 | Excellent 5.3% |
| Immigrants | Ethiopia | 81.4 /100 | #132 | Excellent 5.3% |
| Ethiopians | 80.7 /100 | #133 | Excellent 5.3% |
| Slovaks | 80.5 /100 | #134 | Excellent 5.3% |
| New Zealanders | 79.9 /100 | #135 | Good 5.3% |
| Immigrants | Jordan | 79.5 /100 | #136 | Good 5.3% |
| Jordanians | 78.8 /100 | #137 | Good 5.3% |
| Argentineans | 78.8 /100 | #138 | Good 5.3% |
| Immigrants | Ukraine | 78.5 /100 | #139 | Good 5.3% |
| Immigrants | Norway | 76.2 /100 | #140 | Good 5.3% |
| Venezuelans | 76.0 /100 | #141 | Good 5.3% |
| Immigrants | Venezuela | 75.4 /100 | #142 | Good 5.3% |
| Chileans | 75.0 /100 | #143 | Good 5.3% |
| Immigrants | England | 74.9 /100 | #144 | Good 5.3% |
| Immigrants | Egypt | 74.0 /100 | #145 | Good 5.3% |