Carpatho Rusyn vs Argentinean Unemployment Among Women with Children Under 18 years
COMPARE
Carpatho Rusyn
Argentinean
Unemployment Among Women with Children Under 18 years
Unemployment Among Women with Children Under 18 years Comparison
Carpatho Rusyns
Argentineans
5.4%
UNEMPLOYMENT AMONG WOMEN WITH CHILDREN UNDER 18 YEARS
70.8/ 100
METRIC RATING
153rd/ 347
METRIC RANK
5.3%
UNEMPLOYMENT AMONG WOMEN WITH CHILDREN UNDER 18 YEARS
78.8/ 100
METRIC RATING
138th/ 347
METRIC RANK
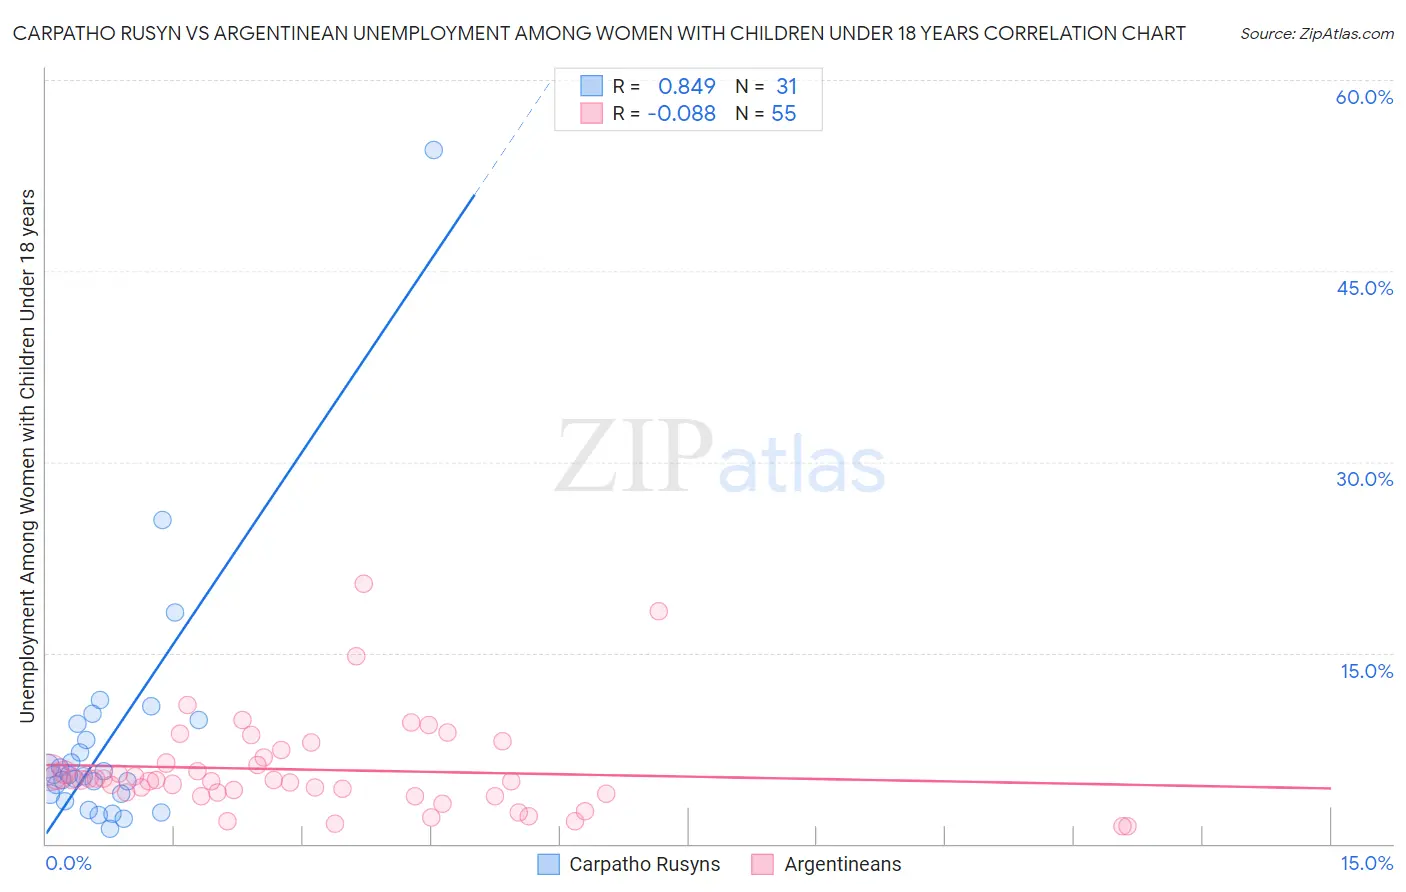
Carpatho Rusyn vs Argentinean Unemployment Among Women with Children Under 18 years Correlation Chart
The statistical analysis conducted on geographies consisting of 58,081,192 people shows a very strong positive correlation between the proportion of Carpatho Rusyns and unemployment rate among women with children under the age of 18 in the United States with a correlation coefficient (R) of 0.849 and weighted average of 5.4%. Similarly, the statistical analysis conducted on geographies consisting of 290,077,964 people shows a slight negative correlation between the proportion of Argentineans and unemployment rate among women with children under the age of 18 in the United States with a correlation coefficient (R) of -0.088 and weighted average of 5.3%, a difference of 0.77%.
Unemployment Among Women with Children Under 18 years Correlation Summary
| Measurement | Carpatho Rusyn | Argentinean |
| Minimum | 1.2% | 1.4% |
| Maximum | 54.5% | 20.5% |
| Range | 53.3% | 19.1% |
| Mean | 8.2% | 5.8% |
| Median | 5.4% | 5.0% |
| Interquartile 25% (IQ1) | 3.9% | 3.9% |
| Interquartile 75% (IQ3) | 9.5% | 6.7% |
| Interquartile Range (IQR) | 5.6% | 2.8% |
| Standard Deviation (Sample) | 9.9% | 3.7% |
| Standard Deviation (Population) | 9.7% | 3.7% |
Demographics Similar to Carpatho Rusyns and Argentineans by Unemployment Among Women with Children Under 18 years
In terms of unemployment among women with children under 18 years, the demographic groups most similar to Carpatho Rusyns are Immigrants from Latvia (5.4%, a difference of 0.0%), Immigrants from South Eastern Asia (5.4%, a difference of 0.020%), Immigrants from Iran (5.4%, a difference of 0.030%), Korean (5.4%, a difference of 0.030%), and Immigrants from Argentina (5.4%, a difference of 0.080%). Similarly, the demographic groups most similar to Argentineans are Jordanian (5.3%, a difference of 0.010%), Immigrants from Ukraine (5.3%, a difference of 0.030%), Immigrants from Jordan (5.3%, a difference of 0.080%), New Zealander (5.3%, a difference of 0.13%), and Immigrants from Norway (5.3%, a difference of 0.27%).
| Demographics | Rating | Rank | Unemployment Among Women with Children Under 18 years |
| New Zealanders | 79.9 /100 | #135 | Good 5.3% |
| Immigrants | Jordan | 79.5 /100 | #136 | Good 5.3% |
| Jordanians | 78.8 /100 | #137 | Good 5.3% |
| Argentineans | 78.8 /100 | #138 | Good 5.3% |
| Immigrants | Ukraine | 78.5 /100 | #139 | Good 5.3% |
| Immigrants | Norway | 76.2 /100 | #140 | Good 5.3% |
| Venezuelans | 76.0 /100 | #141 | Good 5.3% |
| Immigrants | Venezuela | 75.4 /100 | #142 | Good 5.3% |
| Chileans | 75.0 /100 | #143 | Good 5.3% |
| Immigrants | England | 74.9 /100 | #144 | Good 5.3% |
| Immigrants | Egypt | 74.0 /100 | #145 | Good 5.3% |
| Immigrants | Belarus | 73.4 /100 | #146 | Good 5.3% |
| Bangladeshis | 73.2 /100 | #147 | Good 5.3% |
| Immigrants | Western Europe | 72.8 /100 | #148 | Good 5.4% |
| Immigrants | Kenya | 72.2 /100 | #149 | Good 5.4% |
| Immigrants | Argentina | 71.7 /100 | #150 | Good 5.4% |
| Immigrants | Iran | 71.1 /100 | #151 | Good 5.4% |
| Immigrants | South Eastern Asia | 71.1 /100 | #152 | Good 5.4% |
| Carpatho Rusyns | 70.8 /100 | #153 | Good 5.4% |
| Immigrants | Latvia | 70.8 /100 | #154 | Good 5.4% |
| Koreans | 70.5 /100 | #155 | Good 5.4% |