Immigrants from Latvia vs Czech Unemployment Among Ages 55 to 59 years
COMPARE
Immigrants from Latvia
Czech
Unemployment Among Ages 55 to 59 years
Unemployment Among Ages 55 to 59 years Comparison
Immigrants from Latvia
Czechs
4.9%
UNEMPLOYMENT AMONG AGES 55 TO 59 YEARS
18.5/ 100
METRIC RATING
204th/ 347
METRIC RANK
4.4%
UNEMPLOYMENT AMONG AGES 55 TO 59 YEARS
100.0/ 100
METRIC RATING
17th/ 347
METRIC RANK
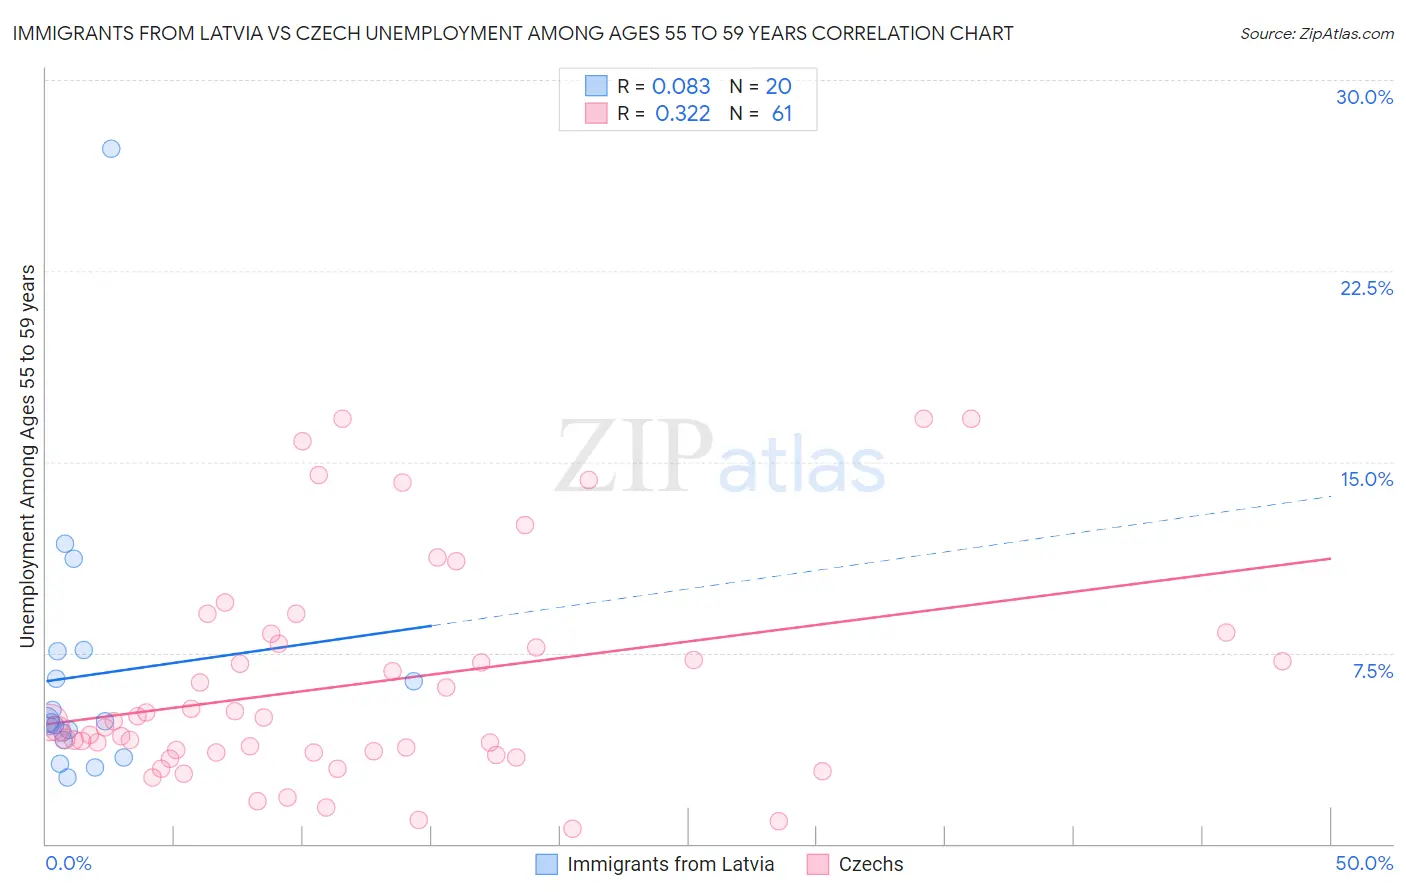
Immigrants from Latvia vs Czech Unemployment Among Ages 55 to 59 years Correlation Chart
The statistical analysis conducted on geographies consisting of 111,271,866 people shows a slight positive correlation between the proportion of Immigrants from Latvia and unemployment rate among population between the ages 55 and 59 in the United States with a correlation coefficient (R) of 0.083 and weighted average of 4.9%. Similarly, the statistical analysis conducted on geographies consisting of 431,294,808 people shows a mild positive correlation between the proportion of Czechs and unemployment rate among population between the ages 55 and 59 in the United States with a correlation coefficient (R) of 0.322 and weighted average of 4.4%, a difference of 12.0%.
Unemployment Among Ages 55 to 59 years Correlation Summary
| Measurement | Immigrants from Latvia | Czech |
| Minimum | 2.6% | 0.60% |
| Maximum | 27.3% | 16.7% |
| Range | 24.7% | 16.1% |
| Mean | 6.6% | 6.3% |
| Median | 4.8% | 4.8% |
| Interquartile 25% (IQ1) | 4.2% | 3.6% |
| Interquartile 75% (IQ3) | 7.0% | 8.1% |
| Interquartile Range (IQR) | 2.8% | 4.5% |
| Standard Deviation (Sample) | 5.5% | 4.2% |
| Standard Deviation (Population) | 5.3% | 4.2% |
Similar Demographics by Unemployment Among Ages 55 to 59 years
Demographics Similar to Immigrants from Latvia by Unemployment Among Ages 55 to 59 years
In terms of unemployment among ages 55 to 59 years, the demographic groups most similar to Immigrants from Latvia are Haitian (4.9%, a difference of 0.020%), Guamanian/Chamorro (4.9%, a difference of 0.15%), Lumbee (4.9%, a difference of 0.25%), Immigrants from South America (4.9%, a difference of 0.28%), and Basque (4.9%, a difference of 0.30%).
| Demographics | Rating | Rank | Unemployment Among Ages 55 to 59 years |
| Macedonians | 26.4 /100 | #197 | Fair 4.9% |
| Immigrants | Philippines | 26.1 /100 | #198 | Fair 4.9% |
| Immigrants | Russia | 23.7 /100 | #199 | Fair 4.9% |
| Basques | 23.3 /100 | #200 | Fair 4.9% |
| Immigrants | South America | 23.1 /100 | #201 | Fair 4.9% |
| Lumbee | 22.5 /100 | #202 | Fair 4.9% |
| Guamanians/Chamorros | 20.8 /100 | #203 | Fair 4.9% |
| Immigrants | Latvia | 18.5 /100 | #204 | Poor 4.9% |
| Haitians | 18.1 /100 | #205 | Poor 4.9% |
| Immigrants | Belarus | 14.1 /100 | #206 | Poor 4.9% |
| Immigrants | Australia | 14.1 /100 | #207 | Poor 4.9% |
| Immigrants | Kazakhstan | 14.0 /100 | #208 | Poor 4.9% |
| Immigrants | Haiti | 13.3 /100 | #209 | Poor 4.9% |
| Creek | 12.9 /100 | #210 | Poor 4.9% |
| Hawaiians | 12.8 /100 | #211 | Poor 4.9% |
Demographics Similar to Czechs by Unemployment Among Ages 55 to 59 years
In terms of unemployment among ages 55 to 59 years, the demographic groups most similar to Czechs are Somali (4.4%, a difference of 0.35%), Bulgarian (4.3%, a difference of 0.59%), Immigrants from Somalia (4.4%, a difference of 0.75%), Immigrants from India (4.3%, a difference of 0.84%), and Chinese (4.4%, a difference of 0.84%).
| Demographics | Rating | Rank | Unemployment Among Ages 55 to 59 years |
| Tongans | 100.0 /100 | #10 | Exceptional 4.3% |
| Immigrants | Congo | 100.0 /100 | #11 | Exceptional 4.3% |
| Danes | 100.0 /100 | #12 | Exceptional 4.3% |
| Indonesians | 100.0 /100 | #13 | Exceptional 4.3% |
| Immigrants | India | 100.0 /100 | #14 | Exceptional 4.3% |
| Bulgarians | 100.0 /100 | #15 | Exceptional 4.3% |
| Somalis | 100.0 /100 | #16 | Exceptional 4.4% |
| Czechs | 100.0 /100 | #17 | Exceptional 4.4% |
| Immigrants | Somalia | 100.0 /100 | #18 | Exceptional 4.4% |
| Chinese | 100.0 /100 | #19 | Exceptional 4.4% |
| Swedes | 100.0 /100 | #20 | Exceptional 4.4% |
| Puget Sound Salish | 100.0 /100 | #21 | Exceptional 4.4% |
| Immigrants | Burma/Myanmar | 100.0 /100 | #22 | Exceptional 4.4% |
| Kenyans | 100.0 /100 | #23 | Exceptional 4.4% |
| Jordanians | 100.0 /100 | #24 | Exceptional 4.4% |