Immigrants from Latin America vs Seminole Unemployment Among Ages 25 to 29 years
COMPARE
Immigrants from Latin America
Seminole
Unemployment Among Ages 25 to 29 years
Unemployment Among Ages 25 to 29 years Comparison
Immigrants from Latin America
Seminole
7.4%
UNEMPLOYMENT AMONG AGES 25 TO 29 YEARS
0.1/ 100
METRIC RATING
269th/ 347
METRIC RANK
7.2%
UNEMPLOYMENT AMONG AGES 25 TO 29 YEARS
0.6/ 100
METRIC RATING
249th/ 347
METRIC RANK
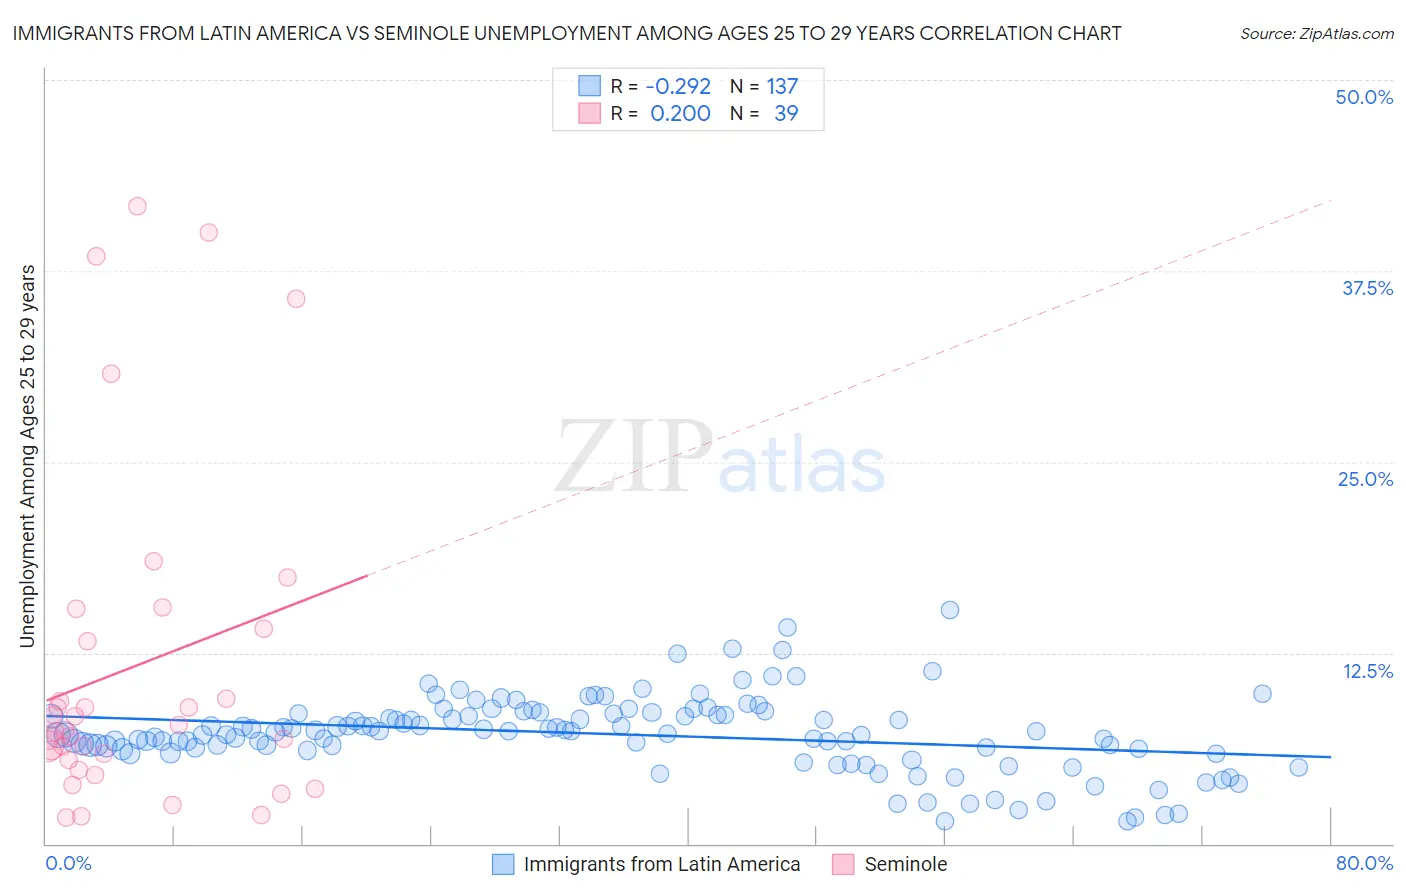
Immigrants from Latin America vs Seminole Unemployment Among Ages 25 to 29 years Correlation Chart
The statistical analysis conducted on geographies consisting of 503,337,302 people shows a weak negative correlation between the proportion of Immigrants from Latin America and unemployment rate among population between the ages 25 and 29 in the United States with a correlation coefficient (R) of -0.292 and weighted average of 7.4%. Similarly, the statistical analysis conducted on geographies consisting of 115,588,504 people shows a weak positive correlation between the proportion of Seminole and unemployment rate among population between the ages 25 and 29 in the United States with a correlation coefficient (R) of 0.200 and weighted average of 7.2%, a difference of 3.4%.
Unemployment Among Ages 25 to 29 years Correlation Summary
| Measurement | Immigrants from Latin America | Seminole |
| Minimum | 1.4% | 1.7% |
| Maximum | 15.3% | 41.7% |
| Range | 13.9% | 40.0% |
| Mean | 7.2% | 11.6% |
| Median | 7.4% | 7.5% |
| Interquartile 25% (IQ1) | 6.2% | 5.5% |
| Interquartile 75% (IQ3) | 8.5% | 14.1% |
| Interquartile Range (IQR) | 2.3% | 8.6% |
| Standard Deviation (Sample) | 2.4% | 10.9% |
| Standard Deviation (Population) | 2.4% | 10.8% |
Demographics Similar to Immigrants from Latin America and Seminole by Unemployment Among Ages 25 to 29 years
In terms of unemployment among ages 25 to 29 years, the demographic groups most similar to Immigrants from Latin America are Immigrants from Ecuador (7.4%, a difference of 0.060%), Pennsylvania German (7.4%, a difference of 0.080%), Paiute (7.4%, a difference of 0.15%), Immigrants from Fiji (7.4%, a difference of 0.29%), and Immigrants from Western Africa (7.4%, a difference of 0.35%). Similarly, the demographic groups most similar to Seminole are Delaware (7.2%, a difference of 0.16%), Portuguese (7.2%, a difference of 0.22%), Sierra Leonean (7.2%, a difference of 0.48%), Immigrants from Portugal (7.2%, a difference of 0.80%), and Ghanaian (7.2%, a difference of 0.95%).
| Demographics | Rating | Rank | Unemployment Among Ages 25 to 29 years |
| Seminole | 0.6 /100 | #249 | Tragic 7.2% |
| Delaware | 0.5 /100 | #250 | Tragic 7.2% |
| Portuguese | 0.5 /100 | #251 | Tragic 7.2% |
| Sierra Leoneans | 0.4 /100 | #252 | Tragic 7.2% |
| Immigrants | Portugal | 0.3 /100 | #253 | Tragic 7.2% |
| Ghanaians | 0.3 /100 | #254 | Tragic 7.2% |
| Immigrants | Cameroon | 0.3 /100 | #255 | Tragic 7.2% |
| Mexican American Indians | 0.3 /100 | #256 | Tragic 7.3% |
| Assyrians/Chaldeans/Syriacs | 0.2 /100 | #257 | Tragic 7.3% |
| Ottawa | 0.1 /100 | #258 | Tragic 7.3% |
| Cree | 0.1 /100 | #259 | Tragic 7.3% |
| Americans | 0.1 /100 | #260 | Tragic 7.4% |
| Nigerians | 0.1 /100 | #261 | Tragic 7.4% |
| Ecuadorians | 0.1 /100 | #262 | Tragic 7.4% |
| Kiowa | 0.1 /100 | #263 | Tragic 7.4% |
| Immigrants | Western Africa | 0.1 /100 | #264 | Tragic 7.4% |
| Immigrants | Fiji | 0.1 /100 | #265 | Tragic 7.4% |
| Paiute | 0.1 /100 | #266 | Tragic 7.4% |
| Pennsylvania Germans | 0.1 /100 | #267 | Tragic 7.4% |
| Immigrants | Ecuador | 0.1 /100 | #268 | Tragic 7.4% |
| Immigrants | Latin America | 0.1 /100 | #269 | Tragic 7.4% |