Immigrants from Latin America vs White/Caucasian Unemployment Among Ages 25 to 29 years
COMPARE
Immigrants from Latin America
White/Caucasian
Unemployment Among Ages 25 to 29 years
Unemployment Among Ages 25 to 29 years Comparison
Immigrants from Latin America
Whites/Caucasians
7.4%
UNEMPLOYMENT AMONG AGES 25 TO 29 YEARS
0.1/ 100
METRIC RATING
269th/ 347
METRIC RANK
6.9%
UNEMPLOYMENT AMONG AGES 25 TO 29 YEARS
10.6/ 100
METRIC RATING
219th/ 347
METRIC RANK
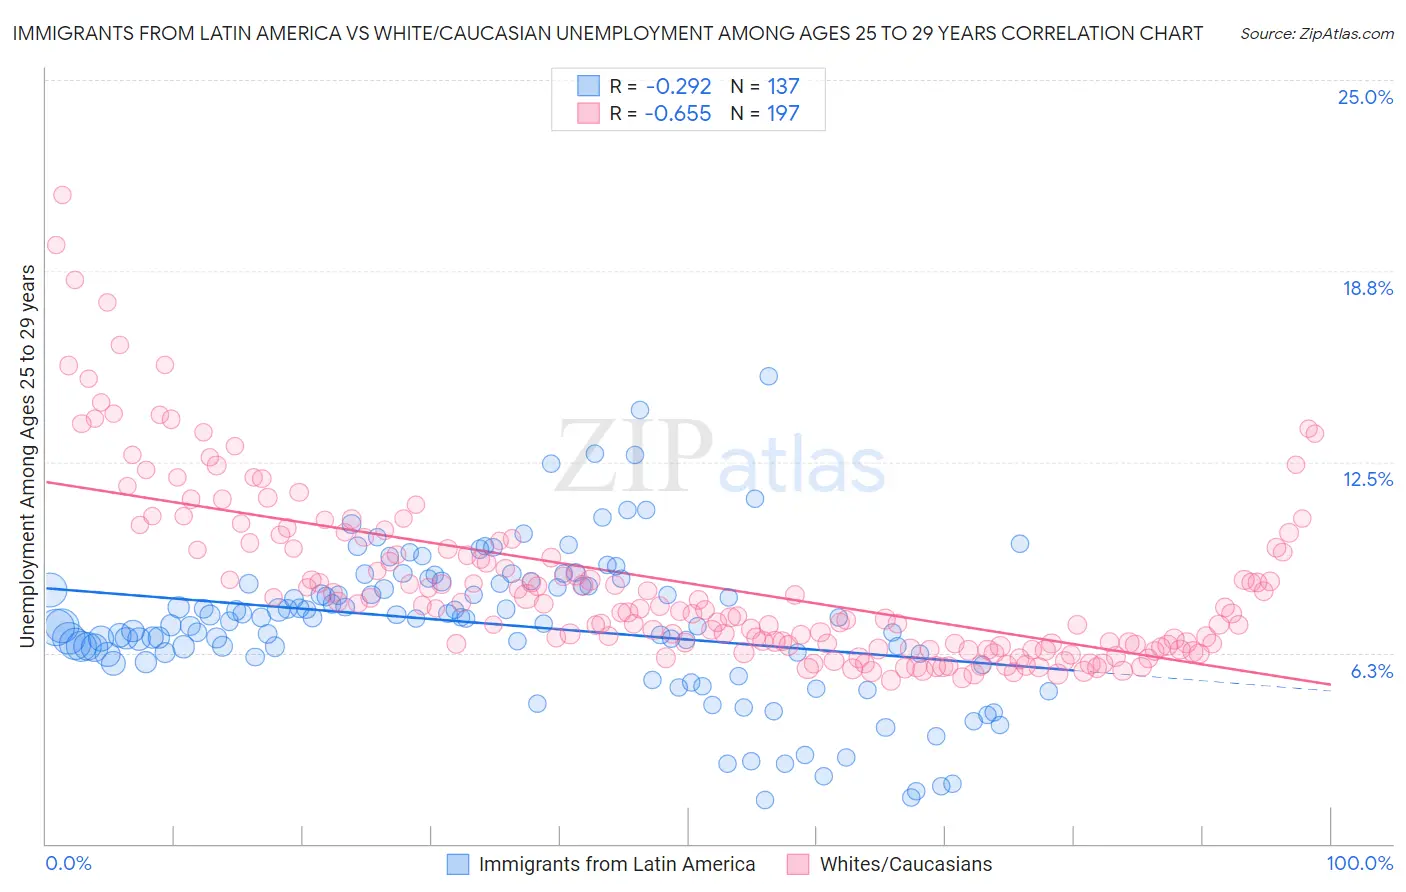
Immigrants from Latin America vs White/Caucasian Unemployment Among Ages 25 to 29 years Correlation Chart
The statistical analysis conducted on geographies consisting of 503,337,302 people shows a weak negative correlation between the proportion of Immigrants from Latin America and unemployment rate among population between the ages 25 and 29 in the United States with a correlation coefficient (R) of -0.292 and weighted average of 7.4%. Similarly, the statistical analysis conducted on geographies consisting of 513,309,764 people shows a significant negative correlation between the proportion of Whites/Caucasians and unemployment rate among population between the ages 25 and 29 in the United States with a correlation coefficient (R) of -0.655 and weighted average of 6.9%, a difference of 8.1%.
Unemployment Among Ages 25 to 29 years Correlation Summary
| Measurement | Immigrants from Latin America | White/Caucasian |
| Minimum | 1.4% | 5.3% |
| Maximum | 15.3% | 21.2% |
| Range | 13.9% | 15.9% |
| Mean | 7.2% | 8.5% |
| Median | 7.4% | 7.7% |
| Interquartile 25% (IQ1) | 6.2% | 6.5% |
| Interquartile 75% (IQ3) | 8.5% | 9.8% |
| Interquartile Range (IQR) | 2.3% | 3.3% |
| Standard Deviation (Sample) | 2.4% | 2.9% |
| Standard Deviation (Population) | 2.4% | 2.9% |
Similar Demographics by Unemployment Among Ages 25 to 29 years
Demographics Similar to Immigrants from Latin America by Unemployment Among Ages 25 to 29 years
In terms of unemployment among ages 25 to 29 years, the demographic groups most similar to Immigrants from Latin America are Immigrants from Ecuador (7.4%, a difference of 0.060%), Pennsylvania German (7.4%, a difference of 0.080%), Paiute (7.4%, a difference of 0.15%), Immigrants from Fiji (7.4%, a difference of 0.29%), and Immigrants from Western Africa (7.4%, a difference of 0.35%).
| Demographics | Rating | Rank | Unemployment Among Ages 25 to 29 years |
| Ecuadorians | 0.1 /100 | #262 | Tragic 7.4% |
| Kiowa | 0.1 /100 | #263 | Tragic 7.4% |
| Immigrants | Western Africa | 0.1 /100 | #264 | Tragic 7.4% |
| Immigrants | Fiji | 0.1 /100 | #265 | Tragic 7.4% |
| Paiute | 0.1 /100 | #266 | Tragic 7.4% |
| Pennsylvania Germans | 0.1 /100 | #267 | Tragic 7.4% |
| Immigrants | Ecuador | 0.1 /100 | #268 | Tragic 7.4% |
| Immigrants | Latin America | 0.1 /100 | #269 | Tragic 7.4% |
| Bahamians | 0.0 /100 | #270 | Tragic 7.5% |
| Choctaw | 0.0 /100 | #271 | Tragic 7.5% |
| Immigrants | Bahamas | 0.0 /100 | #272 | Tragic 7.5% |
| Immigrants | Nigeria | 0.0 /100 | #273 | Tragic 7.5% |
| Immigrants | Central America | 0.0 /100 | #274 | Tragic 7.5% |
| Immigrants | Ghana | 0.0 /100 | #275 | Tragic 7.5% |
| French American Indians | 0.0 /100 | #276 | Tragic 7.5% |
Demographics Similar to Whites/Caucasians by Unemployment Among Ages 25 to 29 years
In terms of unemployment among ages 25 to 29 years, the demographic groups most similar to Whites/Caucasians are French (6.9%, a difference of 0.010%), Israeli (6.9%, a difference of 0.13%), Immigrants from Austria (6.8%, a difference of 0.26%), Ute (6.8%, a difference of 0.40%), and Slovak (6.8%, a difference of 0.51%).
| Demographics | Rating | Rank | Unemployment Among Ages 25 to 29 years |
| Immigrants | Cabo Verde | 16.2 /100 | #212 | Poor 6.8% |
| Immigrants | Syria | 15.1 /100 | #213 | Poor 6.8% |
| Liberians | 14.7 /100 | #214 | Poor 6.8% |
| Spanish | 14.4 /100 | #215 | Poor 6.8% |
| Slovaks | 14.3 /100 | #216 | Poor 6.8% |
| Ute | 13.4 /100 | #217 | Poor 6.8% |
| Immigrants | Austria | 12.3 /100 | #218 | Poor 6.8% |
| Whites/Caucasians | 10.6 /100 | #219 | Poor 6.9% |
| French | 10.5 /100 | #220 | Poor 6.9% |
| Israelis | 9.8 /100 | #221 | Tragic 6.9% |
| Spaniards | 7.7 /100 | #222 | Tragic 6.9% |
| Celtics | 7.6 /100 | #223 | Tragic 6.9% |
| Immigrants | Immigrants | 6.2 /100 | #224 | Tragic 6.9% |
| Japanese | 5.4 /100 | #225 | Tragic 6.9% |
| Immigrants | Liberia | 4.8 /100 | #226 | Tragic 7.0% |