Immigrants from Singapore vs Arab Unemployment Among Women with Children Under 18 years
COMPARE
Immigrants from Singapore
Arab
Unemployment Among Women with Children Under 18 years
Unemployment Among Women with Children Under 18 years Comparison
Immigrants from Singapore
Arabs
4.9%
UNEMPLOYMENT AMONG WOMEN WITH CHILDREN UNDER 18 YEARS
99.8/ 100
METRIC RATING
17th/ 347
METRIC RANK
5.6%
UNEMPLOYMENT AMONG WOMEN WITH CHILDREN UNDER 18 YEARS
21.4/ 100
METRIC RATING
198th/ 347
METRIC RANK
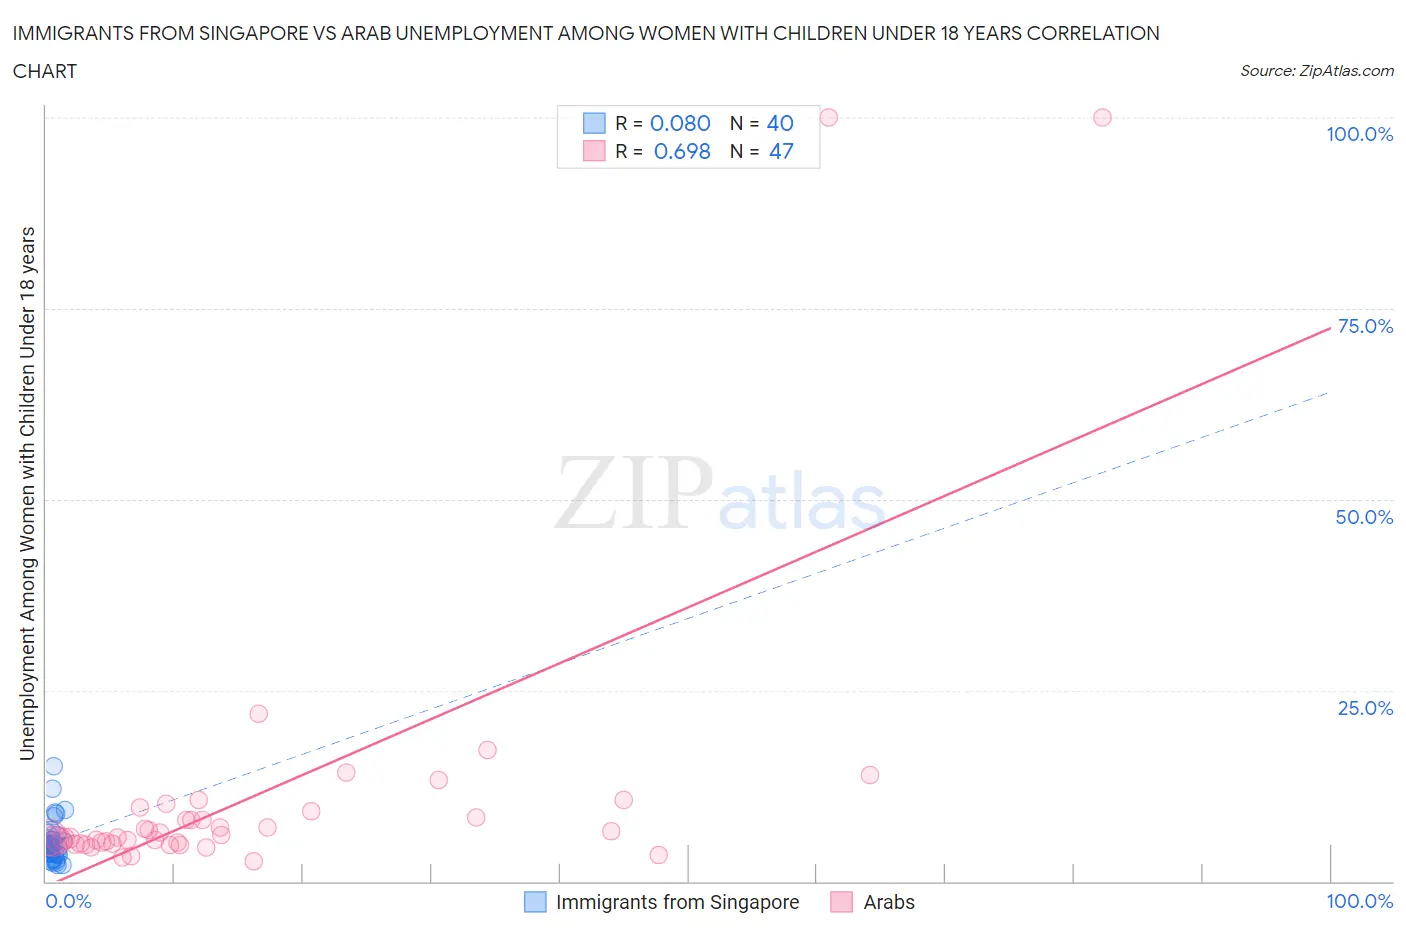
Immigrants from Singapore vs Arab Unemployment Among Women with Children Under 18 years Correlation Chart
The statistical analysis conducted on geographies consisting of 135,664,542 people shows a slight positive correlation between the proportion of Immigrants from Singapore and unemployment rate among women with children under the age of 18 in the United States with a correlation coefficient (R) of 0.080 and weighted average of 4.9%. Similarly, the statistical analysis conducted on geographies consisting of 460,277,043 people shows a significant positive correlation between the proportion of Arabs and unemployment rate among women with children under the age of 18 in the United States with a correlation coefficient (R) of 0.698 and weighted average of 5.6%, a difference of 14.8%.
Unemployment Among Women with Children Under 18 years Correlation Summary
| Measurement | Immigrants from Singapore | Arab |
| Minimum | 2.2% | 2.7% |
| Maximum | 15.1% | 100.0% |
| Range | 12.9% | 97.3% |
| Mean | 5.1% | 11.2% |
| Median | 4.5% | 5.8% |
| Interquartile 25% (IQ1) | 3.6% | 4.9% |
| Interquartile 75% (IQ3) | 5.4% | 9.1% |
| Interquartile Range (IQR) | 1.8% | 4.2% |
| Standard Deviation (Sample) | 2.7% | 19.3% |
| Standard Deviation (Population) | 2.7% | 19.1% |
Similar Demographics by Unemployment Among Women with Children Under 18 years
Demographics Similar to Immigrants from Singapore by Unemployment Among Women with Children Under 18 years
In terms of unemployment among women with children under 18 years, the demographic groups most similar to Immigrants from Singapore are Slovene (4.9%, a difference of 0.11%), Taiwanese (4.8%, a difference of 0.20%), German (4.9%, a difference of 0.26%), Latvian (4.9%, a difference of 0.38%), and Thai (4.8%, a difference of 0.66%).
| Demographics | Rating | Rank | Unemployment Among Women with Children Under 18 years |
| Czechs | 99.9 /100 | #10 | Exceptional 4.7% |
| Filipinos | 99.9 /100 | #11 | Exceptional 4.8% |
| Scandinavians | 99.9 /100 | #12 | Exceptional 4.8% |
| Bulgarians | 99.9 /100 | #13 | Exceptional 4.8% |
| Cambodians | 99.9 /100 | #14 | Exceptional 4.8% |
| Thais | 99.8 /100 | #15 | Exceptional 4.8% |
| Taiwanese | 99.8 /100 | #16 | Exceptional 4.8% |
| Immigrants | Singapore | 99.8 /100 | #17 | Exceptional 4.9% |
| Slovenes | 99.8 /100 | #18 | Exceptional 4.9% |
| Germans | 99.8 /100 | #19 | Exceptional 4.9% |
| Latvians | 99.7 /100 | #20 | Exceptional 4.9% |
| Europeans | 99.6 /100 | #21 | Exceptional 4.9% |
| Indians (Asian) | 99.6 /100 | #22 | Exceptional 4.9% |
| Immigrants | China | 99.6 /100 | #23 | Exceptional 4.9% |
| Belgians | 99.5 /100 | #24 | Exceptional 4.9% |
Demographics Similar to Arabs by Unemployment Among Women with Children Under 18 years
In terms of unemployment among women with children under 18 years, the demographic groups most similar to Arabs are Immigrants from Colombia (5.6%, a difference of 0.0%), Marshallese (5.6%, a difference of 0.13%), Spaniard (5.6%, a difference of 0.14%), Colombian (5.6%, a difference of 0.15%), and Menominee (5.6%, a difference of 0.31%).
| Demographics | Rating | Rank | Unemployment Among Women with Children Under 18 years |
| South American Indians | 30.8 /100 | #191 | Fair 5.5% |
| Immigrants | Spain | 30.7 /100 | #192 | Fair 5.5% |
| Immigrants | Afghanistan | 29.3 /100 | #193 | Fair 5.5% |
| Immigrants | Chile | 29.2 /100 | #194 | Fair 5.5% |
| Colombians | 22.8 /100 | #195 | Fair 5.6% |
| Spaniards | 22.8 /100 | #196 | Fair 5.6% |
| Immigrants | Colombia | 21.4 /100 | #197 | Fair 5.6% |
| Arabs | 21.4 /100 | #198 | Fair 5.6% |
| Marshallese | 20.2 /100 | #199 | Fair 5.6% |
| Menominee | 18.6 /100 | #200 | Poor 5.6% |
| Immigrants | Morocco | 17.9 /100 | #201 | Poor 5.6% |
| Immigrants | Micronesia | 17.1 /100 | #202 | Poor 5.6% |
| Portuguese | 15.9 /100 | #203 | Poor 5.6% |
| Israelis | 15.6 /100 | #204 | Poor 5.6% |
| Tsimshian | 15.2 /100 | #205 | Poor 5.6% |