Immigrants from Kuwait vs Iraqi Unemployment Among Seniors over 65 years
COMPARE
Immigrants from Kuwait
Iraqi
Unemployment Among Seniors over 65 years
Unemployment Among Seniors over 65 years Comparison
Immigrants from Kuwait
Iraqis
4.8%
UNEMPLOYMENT AMONG SENIORS OVER 65 YEARS
100.0/ 100
METRIC RATING
35th/ 347
METRIC RANK
4.7%
UNEMPLOYMENT AMONG SENIORS OVER 65 YEARS
100.0/ 100
METRIC RATING
24th/ 347
METRIC RANK
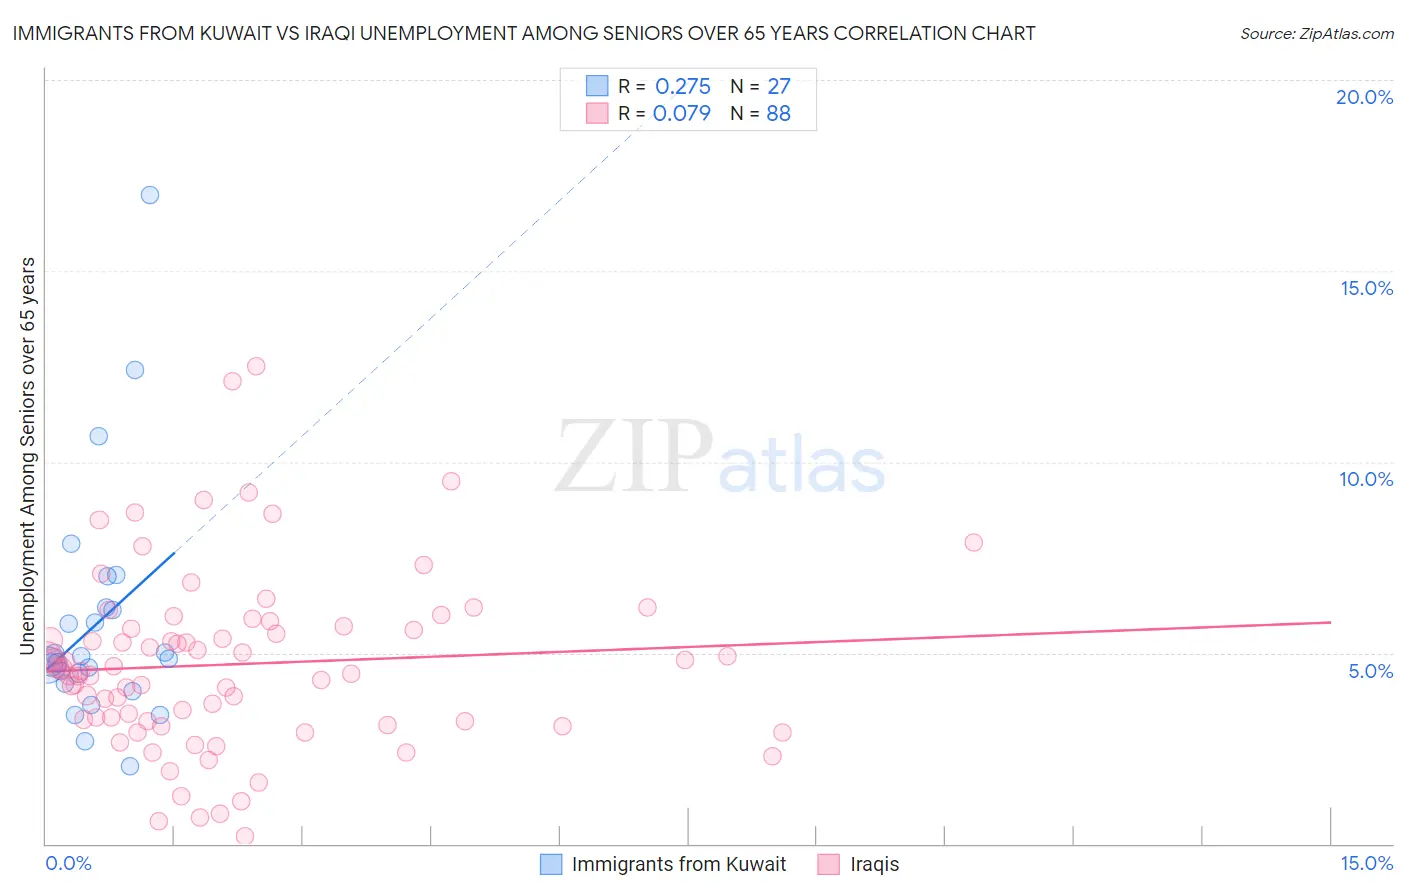
Immigrants from Kuwait vs Iraqi Unemployment Among Seniors over 65 years Correlation Chart
The statistical analysis conducted on geographies consisting of 132,651,314 people shows a weak positive correlation between the proportion of Immigrants from Kuwait and unemployment rate amomg seniors over the age of 65 in the United States with a correlation coefficient (R) of 0.275 and weighted average of 4.8%. Similarly, the statistical analysis conducted on geographies consisting of 163,561,754 people shows a slight positive correlation between the proportion of Iraqis and unemployment rate amomg seniors over the age of 65 in the United States with a correlation coefficient (R) of 0.079 and weighted average of 4.7%, a difference of 1.9%.
Unemployment Among Seniors over 65 years Correlation Summary
| Measurement | Immigrants from Kuwait | Iraqi |
| Minimum | 2.0% | 0.20% |
| Maximum | 17.0% | 12.5% |
| Range | 15.0% | 12.3% |
| Mean | 5.8% | 4.7% |
| Median | 4.9% | 4.5% |
| Interquartile 25% (IQ1) | 4.2% | 3.2% |
| Interquartile 75% (IQ3) | 6.2% | 5.7% |
| Interquartile Range (IQR) | 2.0% | 2.5% |
| Standard Deviation (Sample) | 3.1% | 2.3% |
| Standard Deviation (Population) | 3.1% | 2.3% |
Demographics Similar to Immigrants from Kuwait and Iraqis by Unemployment Among Seniors over 65 years
In terms of unemployment among seniors over 65 years, the demographic groups most similar to Immigrants from Kuwait are Bhutanese (4.8%, a difference of 0.020%), Cambodian (4.8%, a difference of 0.14%), Bulgarian (4.8%, a difference of 0.15%), Immigrants from India (4.8%, a difference of 0.21%), and Macedonian (4.8%, a difference of 0.24%). Similarly, the demographic groups most similar to Iraqis are Tongan (4.7%, a difference of 0.22%), Kenyan (4.7%, a difference of 0.39%), Immigrants from Lebanon (4.8%, a difference of 0.59%), Houma (4.8%, a difference of 0.67%), and Ugandan (4.8%, a difference of 0.74%).
| Demographics | Rating | Rank | Unemployment Among Seniors over 65 years |
| Lebanese | 100.0 /100 | #19 | Exceptional 4.7% |
| Immigrants | Nepal | 100.0 /100 | #20 | Exceptional 4.7% |
| Norwegians | 100.0 /100 | #21 | Exceptional 4.7% |
| Czechs | 100.0 /100 | #22 | Exceptional 4.7% |
| Kenyans | 100.0 /100 | #23 | Exceptional 4.7% |
| Iraqis | 100.0 /100 | #24 | Exceptional 4.7% |
| Tongans | 100.0 /100 | #25 | Exceptional 4.7% |
| Immigrants | Lebanon | 100.0 /100 | #26 | Exceptional 4.8% |
| Houma | 100.0 /100 | #27 | Exceptional 4.8% |
| Ugandans | 100.0 /100 | #28 | Exceptional 4.8% |
| Immigrants | North Macedonia | 100.0 /100 | #29 | Exceptional 4.8% |
| Belgians | 100.0 /100 | #30 | Exceptional 4.8% |
| Immigrants | Uganda | 100.0 /100 | #31 | Exceptional 4.8% |
| Slovenes | 100.0 /100 | #32 | Exceptional 4.8% |
| Palestinians | 100.0 /100 | #33 | Exceptional 4.8% |
| Bhutanese | 100.0 /100 | #34 | Exceptional 4.8% |
| Immigrants | Kuwait | 100.0 /100 | #35 | Exceptional 4.8% |
| Cambodians | 100.0 /100 | #36 | Exceptional 4.8% |
| Bulgarians | 99.9 /100 | #37 | Exceptional 4.8% |
| Immigrants | India | 99.9 /100 | #38 | Exceptional 4.8% |
| Macedonians | 99.9 /100 | #39 | Exceptional 4.8% |