Immigrants from Kuwait vs Immigrants from Peru Male Unemployment
COMPARE
Immigrants from Kuwait
Immigrants from Peru
Male Unemployment
Male Unemployment Comparison
Immigrants from Kuwait
Immigrants from Peru
5.1%
MALE UNEMPLOYMENT
93.3/ 100
METRIC RATING
98th/ 347
METRIC RANK
5.3%
MALE UNEMPLOYMENT
44.6/ 100
METRIC RATING
177th/ 347
METRIC RANK
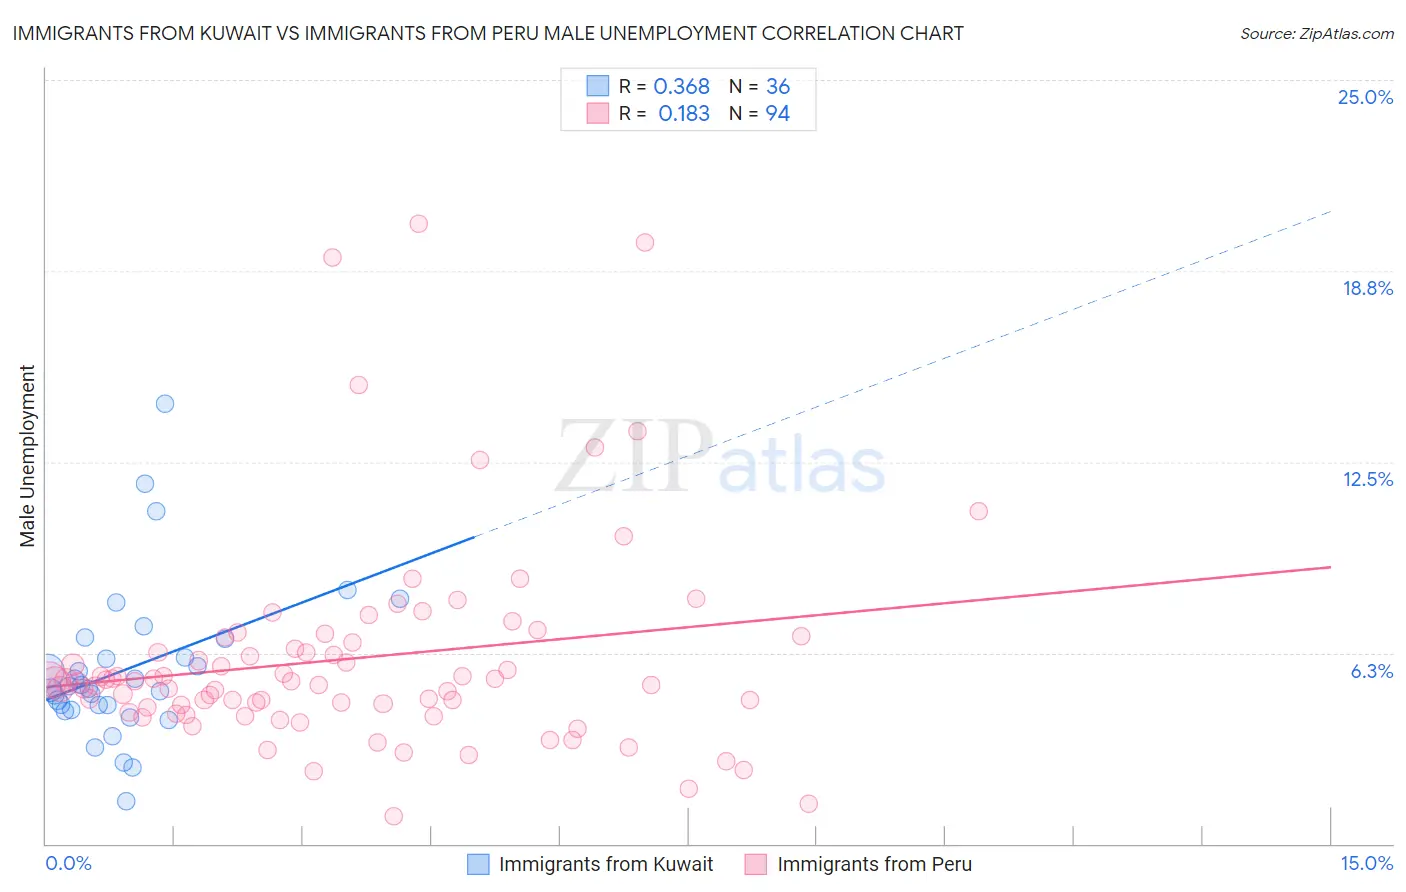
Immigrants from Kuwait vs Immigrants from Peru Male Unemployment Correlation Chart
The statistical analysis conducted on geographies consisting of 136,850,948 people shows a mild positive correlation between the proportion of Immigrants from Kuwait and unemployment rate among males in the United States with a correlation coefficient (R) of 0.368 and weighted average of 5.1%. Similarly, the statistical analysis conducted on geographies consisting of 328,103,434 people shows a poor positive correlation between the proportion of Immigrants from Peru and unemployment rate among males in the United States with a correlation coefficient (R) of 0.183 and weighted average of 5.3%, a difference of 4.3%.
Male Unemployment Correlation Summary
| Measurement | Immigrants from Kuwait | Immigrants from Peru |
| Minimum | 1.4% | 0.90% |
| Maximum | 14.4% | 20.3% |
| Range | 13.0% | 19.4% |
| Mean | 5.7% | 6.1% |
| Median | 5.1% | 5.3% |
| Interquartile 25% (IQ1) | 4.5% | 4.5% |
| Interquartile 75% (IQ3) | 6.4% | 6.6% |
| Interquartile Range (IQR) | 1.9% | 2.1% |
| Standard Deviation (Sample) | 2.5% | 3.4% |
| Standard Deviation (Population) | 2.5% | 3.4% |
Similar Demographics by Male Unemployment
Demographics Similar to Immigrants from Kuwait by Male Unemployment
In terms of male unemployment, the demographic groups most similar to Immigrants from Kuwait are Immigrants from Spain (5.1%, a difference of 0.040%), Uruguayan (5.1%, a difference of 0.070%), Russian (5.1%, a difference of 0.080%), Asian (5.1%, a difference of 0.11%), and German Russian (5.1%, a difference of 0.12%).
| Demographics | Rating | Rank | Male Unemployment |
| Immigrants | Turkey | 94.4 /100 | #91 | Exceptional 5.1% |
| Slavs | 94.2 /100 | #92 | Exceptional 5.1% |
| Immigrants | Serbia | 94.2 /100 | #93 | Exceptional 5.1% |
| Canadians | 94.1 /100 | #94 | Exceptional 5.1% |
| Italians | 93.8 /100 | #95 | Exceptional 5.1% |
| Asians | 93.7 /100 | #96 | Exceptional 5.1% |
| Immigrants | Spain | 93.4 /100 | #97 | Exceptional 5.1% |
| Immigrants | Kuwait | 93.3 /100 | #98 | Exceptional 5.1% |
| Uruguayans | 93.0 /100 | #99 | Exceptional 5.1% |
| Russians | 92.9 /100 | #100 | Exceptional 5.1% |
| German Russians | 92.7 /100 | #101 | Exceptional 5.1% |
| Immigrants | France | 92.7 /100 | #102 | Exceptional 5.1% |
| Immigrants | Jordan | 91.9 /100 | #103 | Exceptional 5.1% |
| Immigrants | Chile | 91.8 /100 | #104 | Exceptional 5.1% |
| Immigrants | Czechoslovakia | 91.7 /100 | #105 | Exceptional 5.1% |
Demographics Similar to Immigrants from Peru by Male Unemployment
In terms of male unemployment, the demographic groups most similar to Immigrants from Peru are Immigrants from Poland (5.3%, a difference of 0.080%), Osage (5.3%, a difference of 0.13%), Immigrants from Iraq (5.3%, a difference of 0.20%), Immigrants from Oceania (5.3%, a difference of 0.23%), and Malaysian (5.3%, a difference of 0.30%).
| Demographics | Rating | Rank | Male Unemployment |
| Immigrants | Eastern Europe | 54.1 /100 | #170 | Average 5.3% |
| Peruvians | 51.9 /100 | #171 | Average 5.3% |
| Immigrants | Kazakhstan | 50.8 /100 | #172 | Average 5.3% |
| Immigrants | Russia | 50.7 /100 | #173 | Average 5.3% |
| Immigrants | Iran | 50.0 /100 | #174 | Average 5.3% |
| Immigrants | Iraq | 48.1 /100 | #175 | Average 5.3% |
| Immigrants | Poland | 46.0 /100 | #176 | Average 5.3% |
| Immigrants | Peru | 44.6 /100 | #177 | Average 5.3% |
| Osage | 42.5 /100 | #178 | Average 5.3% |
| Immigrants | Oceania | 40.8 /100 | #179 | Average 5.3% |
| Malaysians | 39.6 /100 | #180 | Fair 5.3% |
| Immigrants | Afghanistan | 37.9 /100 | #181 | Fair 5.3% |
| Potawatomi | 37.8 /100 | #182 | Fair 5.3% |
| Taiwanese | 37.6 /100 | #183 | Fair 5.3% |
| Spaniards | 35.1 /100 | #184 | Fair 5.3% |