Immigrants from Korea vs Vietnamese Unemployment Among Ages 20 to 24 years
COMPARE
Immigrants from Korea
Vietnamese
Unemployment Among Ages 20 to 24 years
Unemployment Among Ages 20 to 24 years Comparison
Immigrants from Korea
Vietnamese
10.3%
UNEMPLOYMENT AMONG AGES 20 TO 24 YEARS
59.0/ 100
METRIC RATING
164th/ 347
METRIC RANK
12.6%
UNEMPLOYMENT AMONG AGES 20 TO 24 YEARS
0.0/ 100
METRIC RATING
311th/ 347
METRIC RANK
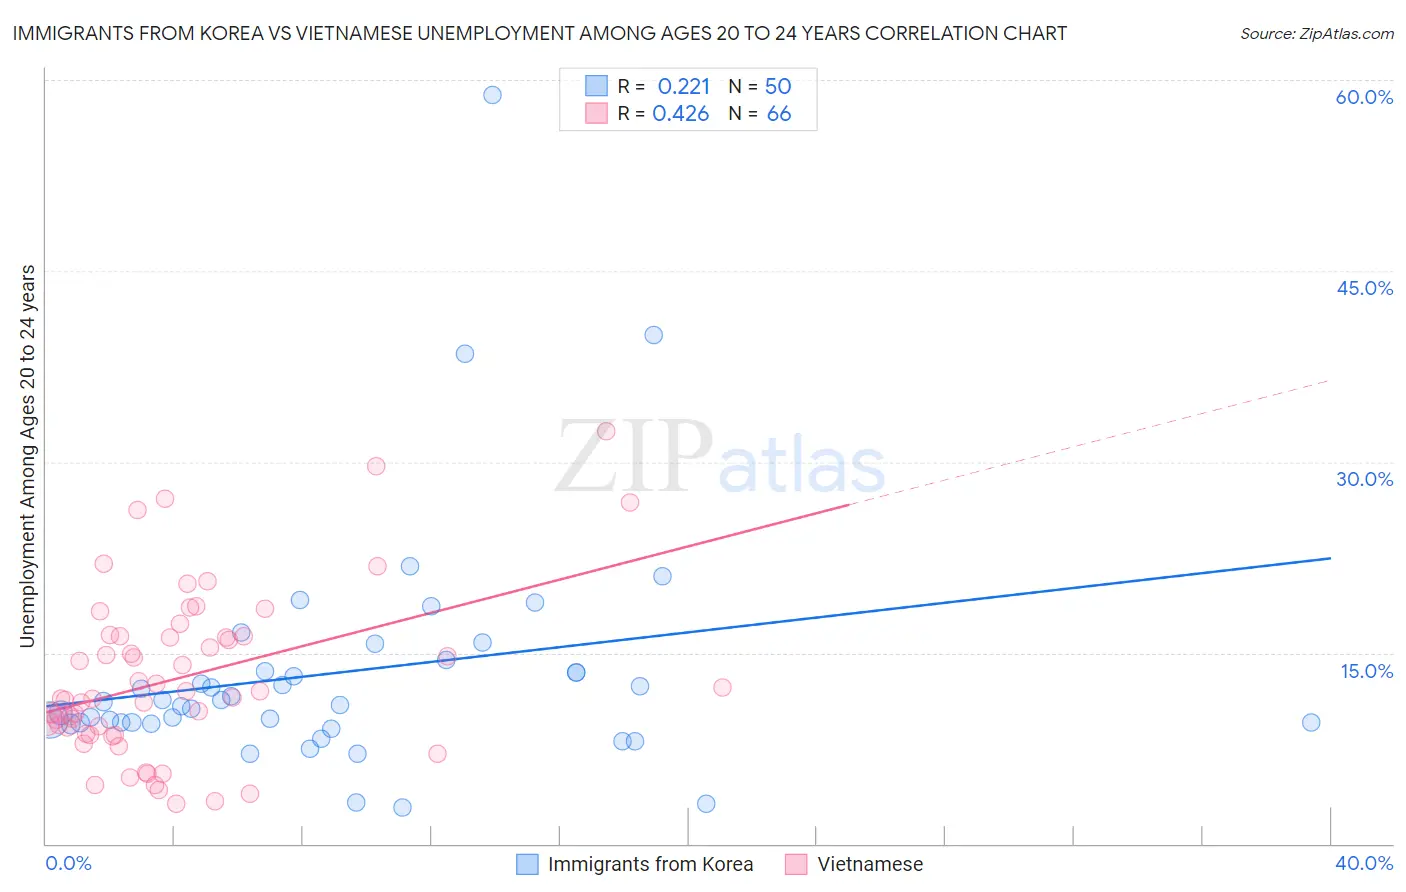
Immigrants from Korea vs Vietnamese Unemployment Among Ages 20 to 24 years Correlation Chart
The statistical analysis conducted on geographies consisting of 402,931,070 people shows a weak positive correlation between the proportion of Immigrants from Korea and unemployment rate among population between the ages 20 and 24 in the United States with a correlation coefficient (R) of 0.221 and weighted average of 10.3%. Similarly, the statistical analysis conducted on geographies consisting of 169,456,792 people shows a moderate positive correlation between the proportion of Vietnamese and unemployment rate among population between the ages 20 and 24 in the United States with a correlation coefficient (R) of 0.426 and weighted average of 12.6%, a difference of 22.9%.
Unemployment Among Ages 20 to 24 years Correlation Summary
| Measurement | Immigrants from Korea | Vietnamese |
| Minimum | 2.8% | 3.1% |
| Maximum | 58.8% | 32.4% |
| Range | 56.0% | 29.3% |
| Mean | 13.5% | 13.0% |
| Median | 11.0% | 11.5% |
| Interquartile 25% (IQ1) | 9.5% | 8.6% |
| Interquartile 75% (IQ3) | 13.5% | 16.3% |
| Interquartile Range (IQR) | 4.0% | 7.7% |
| Standard Deviation (Sample) | 9.5% | 6.5% |
| Standard Deviation (Population) | 9.4% | 6.4% |
Similar Demographics by Unemployment Among Ages 20 to 24 years
Demographics Similar to Immigrants from Korea by Unemployment Among Ages 20 to 24 years
In terms of unemployment among ages 20 to 24 years, the demographic groups most similar to Immigrants from Korea are Lebanese (10.3%, a difference of 0.030%), Italian (10.3%, a difference of 0.050%), Immigrants from Fiji (10.3%, a difference of 0.050%), Estonian (10.3%, a difference of 0.080%), and Immigrants from Asia (10.3%, a difference of 0.090%).
| Demographics | Rating | Rank | Unemployment Among Ages 20 to 24 years |
| Immigrants | Uganda | 65.6 /100 | #157 | Good 10.2% |
| Immigrants | Kazakhstan | 65.5 /100 | #158 | Good 10.2% |
| Immigrants | England | 63.7 /100 | #159 | Good 10.3% |
| Spaniards | 63.4 /100 | #160 | Good 10.3% |
| Indians (Asian) | 62.6 /100 | #161 | Good 10.3% |
| Immigrants | Asia | 61.3 /100 | #162 | Good 10.3% |
| Estonians | 61.1 /100 | #163 | Good 10.3% |
| Immigrants | Korea | 59.0 /100 | #164 | Average 10.3% |
| Lebanese | 58.3 /100 | #165 | Average 10.3% |
| Italians | 57.7 /100 | #166 | Average 10.3% |
| Immigrants | Fiji | 57.6 /100 | #167 | Average 10.3% |
| Iraqis | 56.7 /100 | #168 | Average 10.3% |
| Immigrants | Colombia | 56.3 /100 | #169 | Average 10.3% |
| Turks | 55.2 /100 | #170 | Average 10.3% |
| Immigrants | Eastern Asia | 52.7 /100 | #171 | Average 10.3% |
Demographics Similar to Vietnamese by Unemployment Among Ages 20 to 24 years
In terms of unemployment among ages 20 to 24 years, the demographic groups most similar to Vietnamese are Houma (12.6%, a difference of 0.15%), Jamaican (12.6%, a difference of 0.44%), Immigrants from Bangladesh (12.6%, a difference of 0.57%), Tohono O'odham (12.5%, a difference of 0.64%), and Shoshone (12.7%, a difference of 0.69%).
| Demographics | Rating | Rank | Unemployment Among Ages 20 to 24 years |
| Immigrants | West Indies | 0.0 /100 | #304 | Tragic 12.3% |
| Chippewa | 0.0 /100 | #305 | Tragic 12.3% |
| Immigrants | Haiti | 0.0 /100 | #306 | Tragic 12.4% |
| Bermudans | 0.0 /100 | #307 | Tragic 12.5% |
| Tohono O'odham | 0.0 /100 | #308 | Tragic 12.5% |
| Immigrants | Bangladesh | 0.0 /100 | #309 | Tragic 12.6% |
| Jamaicans | 0.0 /100 | #310 | Tragic 12.6% |
| Vietnamese | 0.0 /100 | #311 | Tragic 12.6% |
| Houma | 0.0 /100 | #312 | Tragic 12.6% |
| Shoshone | 0.0 /100 | #313 | Tragic 12.7% |
| Blacks/African Americans | 0.0 /100 | #314 | Tragic 12.7% |
| West Indians | 0.0 /100 | #315 | Tragic 12.8% |
| Immigrants | Dominica | 0.0 /100 | #316 | Tragic 12.8% |
| Immigrants | Trinidad and Tobago | 0.0 /100 | #317 | Tragic 12.8% |
| Barbadians | 0.0 /100 | #318 | Tragic 12.9% |