Immigrants from Korea vs Argentinean Unemployment Among Ages 20 to 24 years
COMPARE
Immigrants from Korea
Argentinean
Unemployment Among Ages 20 to 24 years
Unemployment Among Ages 20 to 24 years Comparison
Immigrants from Korea
Argentineans
10.3%
UNEMPLOYMENT AMONG AGES 20 TO 24 YEARS
59.0/ 100
METRIC RATING
164th/ 347
METRIC RANK
10.2%
UNEMPLOYMENT AMONG AGES 20 TO 24 YEARS
78.0/ 100
METRIC RATING
145th/ 347
METRIC RANK
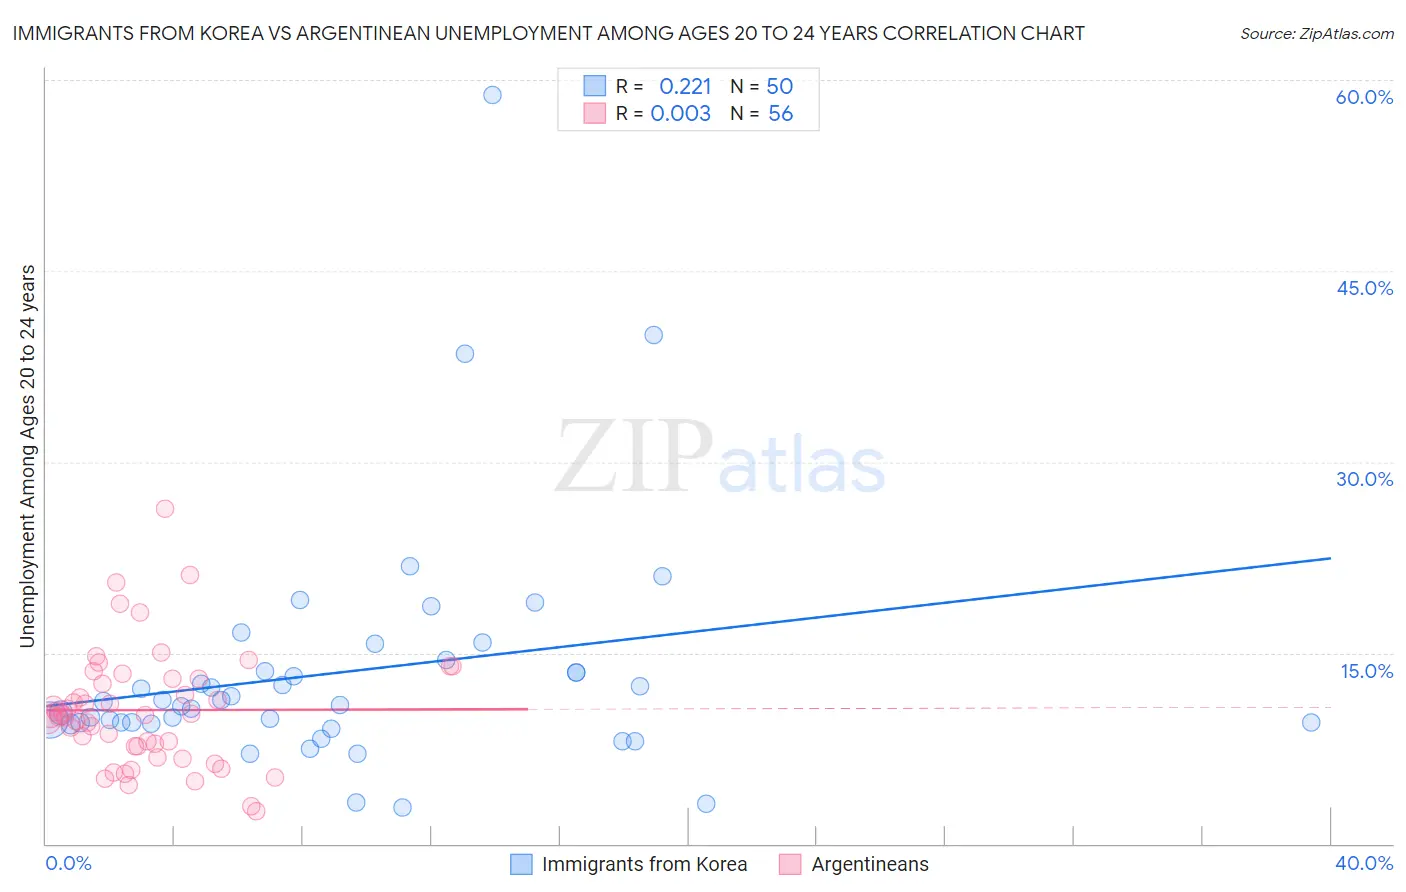
Immigrants from Korea vs Argentinean Unemployment Among Ages 20 to 24 years Correlation Chart
The statistical analysis conducted on geographies consisting of 402,931,070 people shows a weak positive correlation between the proportion of Immigrants from Korea and unemployment rate among population between the ages 20 and 24 in the United States with a correlation coefficient (R) of 0.221 and weighted average of 10.3%. Similarly, the statistical analysis conducted on geographies consisting of 292,519,448 people shows no correlation between the proportion of Argentineans and unemployment rate among population between the ages 20 and 24 in the United States with a correlation coefficient (R) of 0.003 and weighted average of 10.2%, a difference of 0.84%.
Unemployment Among Ages 20 to 24 years Correlation Summary
| Measurement | Immigrants from Korea | Argentinean |
| Minimum | 2.8% | 2.6% |
| Maximum | 58.8% | 26.3% |
| Range | 56.0% | 23.7% |
| Mean | 13.5% | 10.5% |
| Median | 11.0% | 10.1% |
| Interquartile 25% (IQ1) | 9.5% | 7.6% |
| Interquartile 75% (IQ3) | 13.5% | 13.0% |
| Interquartile Range (IQR) | 4.0% | 5.4% |
| Standard Deviation (Sample) | 9.5% | 4.6% |
| Standard Deviation (Population) | 9.4% | 4.5% |
Demographics Similar to Immigrants from Korea and Argentineans by Unemployment Among Ages 20 to 24 years
In terms of unemployment among ages 20 to 24 years, the demographic groups most similar to Immigrants from Korea are Estonian (10.3%, a difference of 0.080%), Immigrants from Asia (10.3%, a difference of 0.090%), Indian (Asian) (10.3%, a difference of 0.14%), Spaniard (10.3%, a difference of 0.17%), and Immigrants from England (10.3%, a difference of 0.18%). Similarly, the demographic groups most similar to Argentineans are Brazilian (10.2%, a difference of 0.020%), Asian (10.2%, a difference of 0.020%), French Canadian (10.2%, a difference of 0.030%), Immigrants from Romania (10.2%, a difference of 0.12%), and Immigrants from Scotland (10.2%, a difference of 0.18%).
| Demographics | Rating | Rank | Unemployment Among Ages 20 to 24 years |
| Brazilians | 78.4 /100 | #144 | Good 10.2% |
| Argentineans | 78.0 /100 | #145 | Good 10.2% |
| Asians | 77.7 /100 | #146 | Good 10.2% |
| French Canadians | 77.5 /100 | #147 | Good 10.2% |
| Immigrants | Romania | 75.7 /100 | #148 | Good 10.2% |
| Immigrants | Scotland | 74.6 /100 | #149 | Good 10.2% |
| Hungarians | 74.4 /100 | #150 | Good 10.2% |
| Immigrants | South Africa | 73.6 /100 | #151 | Good 10.2% |
| Iranians | 72.4 /100 | #152 | Good 10.2% |
| Immigrants | Taiwan | 71.4 /100 | #153 | Good 10.2% |
| Immigrants | Switzerland | 71.3 /100 | #154 | Good 10.2% |
| Lithuanians | 70.0 /100 | #155 | Good 10.2% |
| Canadians | 66.7 /100 | #156 | Good 10.2% |
| Immigrants | Uganda | 65.6 /100 | #157 | Good 10.2% |
| Immigrants | Kazakhstan | 65.5 /100 | #158 | Good 10.2% |
| Immigrants | England | 63.7 /100 | #159 | Good 10.3% |
| Spaniards | 63.4 /100 | #160 | Good 10.3% |
| Indians (Asian) | 62.6 /100 | #161 | Good 10.3% |
| Immigrants | Asia | 61.3 /100 | #162 | Good 10.3% |
| Estonians | 61.1 /100 | #163 | Good 10.3% |
| Immigrants | Korea | 59.0 /100 | #164 | Average 10.3% |