Norwegian vs Vietnamese Unemployment Among Ages 20 to 24 years
COMPARE
Norwegian
Vietnamese
Unemployment Among Ages 20 to 24 years
Unemployment Among Ages 20 to 24 years Comparison
Norwegians
Vietnamese
9.0%
UNEMPLOYMENT AMONG AGES 20 TO 24 YEARS
100.0/ 100
METRIC RATING
5th/ 347
METRIC RANK
12.6%
UNEMPLOYMENT AMONG AGES 20 TO 24 YEARS
0.0/ 100
METRIC RATING
311th/ 347
METRIC RANK
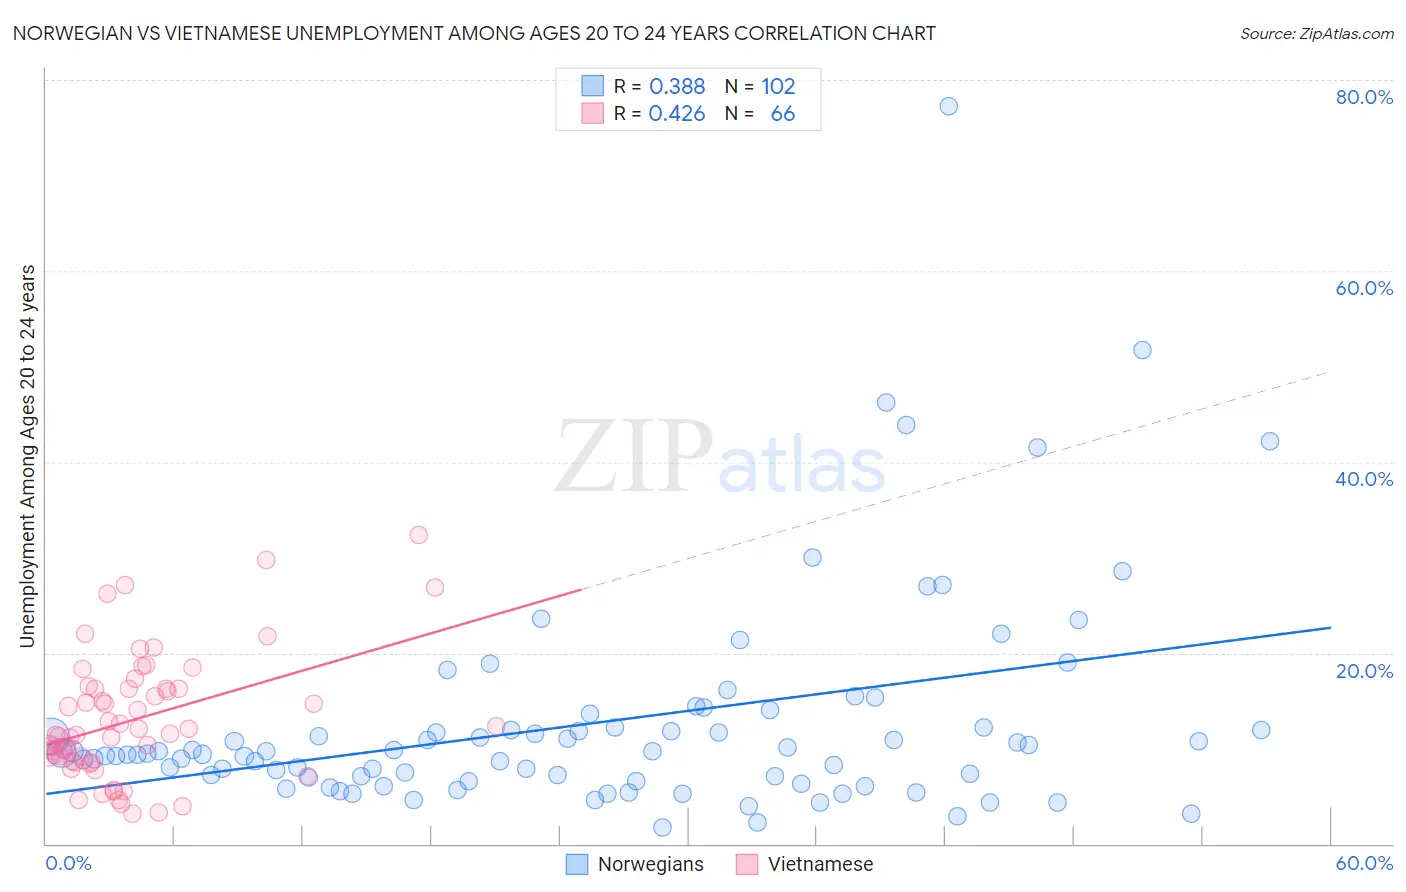
Norwegian vs Vietnamese Unemployment Among Ages 20 to 24 years Correlation Chart
The statistical analysis conducted on geographies consisting of 494,868,089 people shows a mild positive correlation between the proportion of Norwegians and unemployment rate among population between the ages 20 and 24 in the United States with a correlation coefficient (R) of 0.388 and weighted average of 9.0%. Similarly, the statistical analysis conducted on geographies consisting of 169,456,792 people shows a moderate positive correlation between the proportion of Vietnamese and unemployment rate among population between the ages 20 and 24 in the United States with a correlation coefficient (R) of 0.426 and weighted average of 12.6%, a difference of 39.8%.
Unemployment Among Ages 20 to 24 years Correlation Summary
| Measurement | Norwegian | Vietnamese |
| Minimum | 1.7% | 3.1% |
| Maximum | 77.3% | 32.4% |
| Range | 75.6% | 29.3% |
| Mean | 12.7% | 13.0% |
| Median | 9.5% | 11.5% |
| Interquartile 25% (IQ1) | 6.9% | 8.6% |
| Interquartile 75% (IQ3) | 12.1% | 16.3% |
| Interquartile Range (IQR) | 5.2% | 7.7% |
| Standard Deviation (Sample) | 11.4% | 6.5% |
| Standard Deviation (Population) | 11.4% | 6.4% |
Similar Demographics by Unemployment Among Ages 20 to 24 years
Demographics Similar to Norwegians by Unemployment Among Ages 20 to 24 years
In terms of unemployment among ages 20 to 24 years, the demographic groups most similar to Norwegians are Venezuelan (9.0%, a difference of 0.22%), Indonesian (9.0%, a difference of 0.43%), Immigrants from Burma/Myanmar (9.1%, a difference of 0.60%), Luxembourger (9.1%, a difference of 0.97%), and Somali (9.1%, a difference of 0.99%).
| Demographics | Rating | Rank | Unemployment Among Ages 20 to 24 years |
| Immigrants | Cuba | 100.0 /100 | #1 | Exceptional 8.7% |
| Immigrants | Venezuela | 100.0 /100 | #2 | Exceptional 8.9% |
| Indonesians | 100.0 /100 | #3 | Exceptional 9.0% |
| Venezuelans | 100.0 /100 | #4 | Exceptional 9.0% |
| Norwegians | 100.0 /100 | #5 | Exceptional 9.0% |
| Immigrants | Burma/Myanmar | 100.0 /100 | #6 | Exceptional 9.1% |
| Luxembourgers | 100.0 /100 | #7 | Exceptional 9.1% |
| Somalis | 100.0 /100 | #8 | Exceptional 9.1% |
| Immigrants | Somalia | 100.0 /100 | #9 | Exceptional 9.2% |
| Sudanese | 100.0 /100 | #10 | Exceptional 9.2% |
| Zimbabweans | 100.0 /100 | #11 | Exceptional 9.2% |
| Cubans | 100.0 /100 | #12 | Exceptional 9.2% |
| Immigrants | Congo | 100.0 /100 | #13 | Exceptional 9.2% |
| Slovenes | 100.0 /100 | #14 | Exceptional 9.3% |
| Immigrants | Sudan | 100.0 /100 | #15 | Exceptional 9.3% |
Demographics Similar to Vietnamese by Unemployment Among Ages 20 to 24 years
In terms of unemployment among ages 20 to 24 years, the demographic groups most similar to Vietnamese are Houma (12.6%, a difference of 0.15%), Jamaican (12.6%, a difference of 0.44%), Immigrants from Bangladesh (12.6%, a difference of 0.57%), Tohono O'odham (12.5%, a difference of 0.64%), and Shoshone (12.7%, a difference of 0.69%).
| Demographics | Rating | Rank | Unemployment Among Ages 20 to 24 years |
| Immigrants | West Indies | 0.0 /100 | #304 | Tragic 12.3% |
| Chippewa | 0.0 /100 | #305 | Tragic 12.3% |
| Immigrants | Haiti | 0.0 /100 | #306 | Tragic 12.4% |
| Bermudans | 0.0 /100 | #307 | Tragic 12.5% |
| Tohono O'odham | 0.0 /100 | #308 | Tragic 12.5% |
| Immigrants | Bangladesh | 0.0 /100 | #309 | Tragic 12.6% |
| Jamaicans | 0.0 /100 | #310 | Tragic 12.6% |
| Vietnamese | 0.0 /100 | #311 | Tragic 12.6% |
| Houma | 0.0 /100 | #312 | Tragic 12.6% |
| Shoshone | 0.0 /100 | #313 | Tragic 12.7% |
| Blacks/African Americans | 0.0 /100 | #314 | Tragic 12.7% |
| West Indians | 0.0 /100 | #315 | Tragic 12.8% |
| Immigrants | Dominica | 0.0 /100 | #316 | Tragic 12.8% |
| Immigrants | Trinidad and Tobago | 0.0 /100 | #317 | Tragic 12.8% |
| Barbadians | 0.0 /100 | #318 | Tragic 12.9% |