Immigrants from Senegal vs Mexican American Indian Unemployment Among Women with Children Under 18 years
COMPARE
Immigrants from Senegal
Mexican American Indian
Unemployment Among Women with Children Under 18 years
Unemployment Among Women with Children Under 18 years Comparison
Immigrants from Senegal
Mexican American Indians
6.4%
UNEMPLOYMENT AMONG WOMEN WITH CHILDREN UNDER 18 YEARS
0.0/ 100
METRIC RATING
297th/ 347
METRIC RANK
6.2%
UNEMPLOYMENT AMONG WOMEN WITH CHILDREN UNDER 18 YEARS
0.0/ 100
METRIC RATING
277th/ 347
METRIC RANK
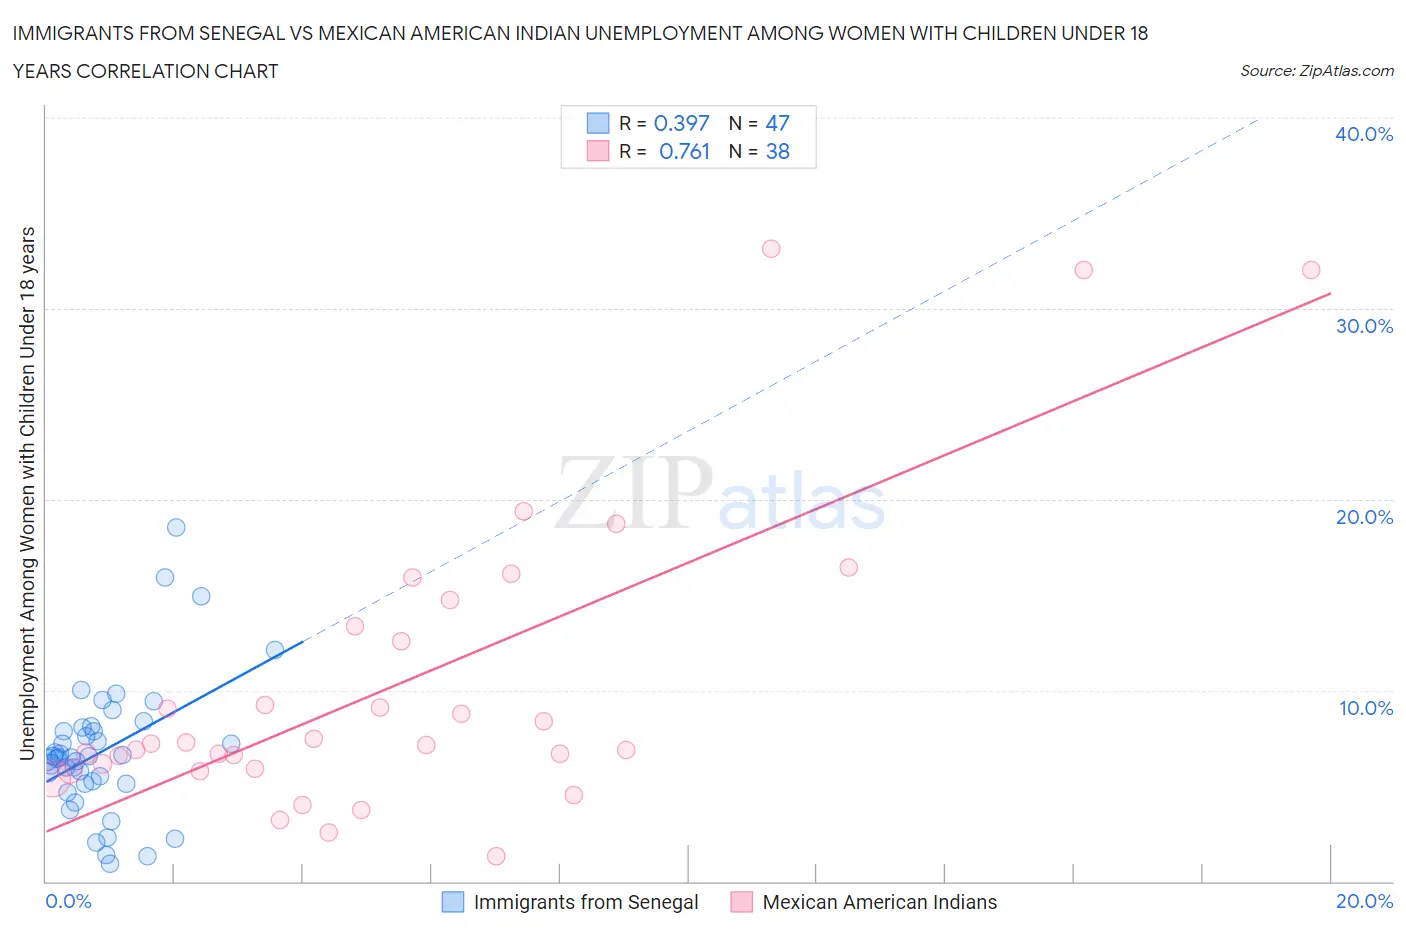
Immigrants from Senegal vs Mexican American Indian Unemployment Among Women with Children Under 18 years Correlation Chart
The statistical analysis conducted on geographies consisting of 89,520,868 people shows a mild positive correlation between the proportion of Immigrants from Senegal and unemployment rate among women with children under the age of 18 in the United States with a correlation coefficient (R) of 0.397 and weighted average of 6.4%. Similarly, the statistical analysis conducted on geographies consisting of 310,243,833 people shows a strong positive correlation between the proportion of Mexican American Indians and unemployment rate among women with children under the age of 18 in the United States with a correlation coefficient (R) of 0.761 and weighted average of 6.2%, a difference of 2.5%.
Unemployment Among Women with Children Under 18 years Correlation Summary
| Measurement | Immigrants from Senegal | Mexican American Indian |
| Minimum | 0.90% | 1.3% |
| Maximum | 18.5% | 33.1% |
| Range | 17.6% | 31.8% |
| Mean | 6.8% | 10.3% |
| Median | 6.5% | 7.2% |
| Interquartile 25% (IQ1) | 5.1% | 5.9% |
| Interquartile 75% (IQ3) | 8.0% | 13.4% |
| Interquartile Range (IQR) | 2.9% | 7.5% |
| Standard Deviation (Sample) | 3.5% | 7.9% |
| Standard Deviation (Population) | 3.5% | 7.8% |
Demographics Similar to Immigrants from Senegal and Mexican American Indians by Unemployment Among Women with Children Under 18 years
In terms of unemployment among women with children under 18 years, the demographic groups most similar to Immigrants from Senegal are Haitian (6.4%, a difference of 0.040%), Barbadian (6.4%, a difference of 0.060%), Honduran (6.4%, a difference of 0.14%), Immigrants from Bangladesh (6.4%, a difference of 0.17%), and Mexican (6.4%, a difference of 0.20%). Similarly, the demographic groups most similar to Mexican American Indians are Immigrants from Barbados (6.2%, a difference of 0.010%), Immigrants from Portugal (6.3%, a difference of 0.40%), Guatemalan (6.3%, a difference of 0.91%), Immigrants from El Salvador (6.3%, a difference of 1.1%), and Immigrants from St. Vincent and the Grenadines (6.3%, a difference of 1.1%).
| Demographics | Rating | Rank | Unemployment Among Women with Children Under 18 years |
| Mexican American Indians | 0.0 /100 | #277 | Tragic 6.2% |
| Immigrants | Barbados | 0.0 /100 | #278 | Tragic 6.2% |
| Immigrants | Portugal | 0.0 /100 | #279 | Tragic 6.3% |
| Guatemalans | 0.0 /100 | #280 | Tragic 6.3% |
| Immigrants | El Salvador | 0.0 /100 | #281 | Tragic 6.3% |
| Immigrants | St. Vincent and the Grenadines | 0.0 /100 | #282 | Tragic 6.3% |
| West Indians | 0.0 /100 | #283 | Tragic 6.3% |
| Immigrants | Grenada | 0.0 /100 | #284 | Tragic 6.3% |
| Bahamians | 0.0 /100 | #285 | Tragic 6.3% |
| Alaskan Athabascans | 0.0 /100 | #286 | Tragic 6.3% |
| Kiowa | 0.0 /100 | #287 | Tragic 6.3% |
| Cree | 0.0 /100 | #288 | Tragic 6.3% |
| Immigrants | Caribbean | 0.0 /100 | #289 | Tragic 6.4% |
| Blackfeet | 0.0 /100 | #290 | Tragic 6.4% |
| Immigrants | Guatemala | 0.0 /100 | #291 | Tragic 6.4% |
| Mexicans | 0.0 /100 | #292 | Tragic 6.4% |
| Immigrants | Bangladesh | 0.0 /100 | #293 | Tragic 6.4% |
| Hondurans | 0.0 /100 | #294 | Tragic 6.4% |
| Barbadians | 0.0 /100 | #295 | Tragic 6.4% |
| Haitians | 0.0 /100 | #296 | Tragic 6.4% |
| Immigrants | Senegal | 0.0 /100 | #297 | Tragic 6.4% |