Crow vs Black/African American Unemployment Among Ages 65 to 74 years
COMPARE
Crow
Black/African American
Unemployment Among Ages 65 to 74 years
Unemployment Among Ages 65 to 74 years Comparison
Crow
Blacks/African Americans
17.4%
UNEMPLOYMENT AMONG AGES 65 TO 74 YEARS
0.0/ 100
METRIC RATING
347th/ 347
METRIC RANK
5.8%
UNEMPLOYMENT AMONG AGES 65 TO 74 YEARS
0.0/ 100
METRIC RATING
295th/ 347
METRIC RANK
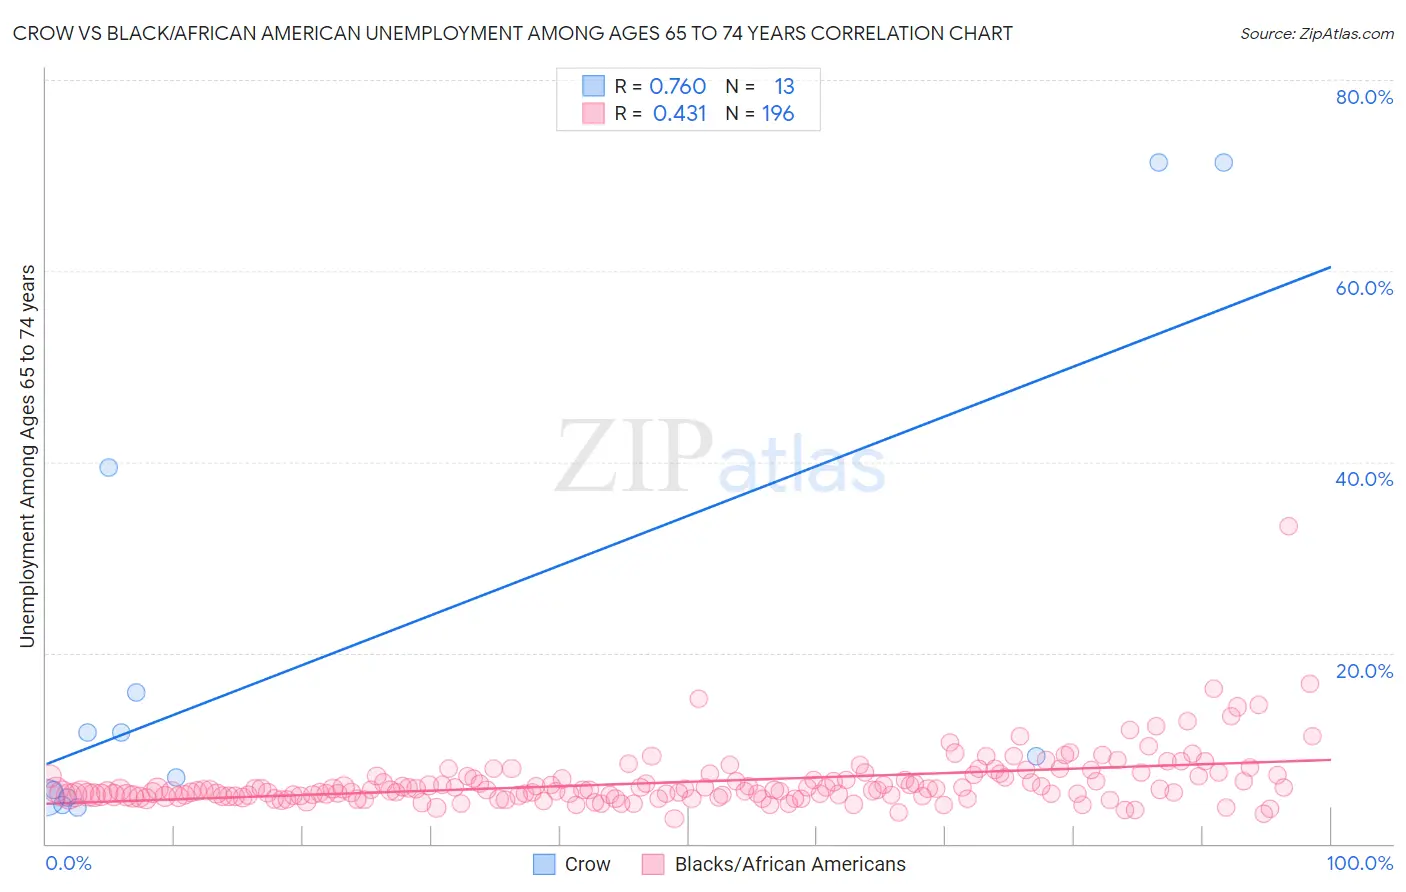
Crow vs Black/African American Unemployment Among Ages 65 to 74 years Correlation Chart
The statistical analysis conducted on geographies consisting of 55,742,978 people shows a strong positive correlation between the proportion of Crow and unemployment rate among population between the ages 65 and 74 in the United States with a correlation coefficient (R) of 0.760 and weighted average of 17.4%. Similarly, the statistical analysis conducted on geographies consisting of 445,511,651 people shows a moderate positive correlation between the proportion of Blacks/African Americans and unemployment rate among population between the ages 65 and 74 in the United States with a correlation coefficient (R) of 0.431 and weighted average of 5.8%, a difference of 201.6%.
Unemployment Among Ages 65 to 74 years Correlation Summary
| Measurement | Crow | Black/African American |
| Minimum | 3.9% | 2.6% |
| Maximum | 71.4% | 33.3% |
| Range | 67.5% | 30.7% |
| Mean | 20.0% | 6.5% |
| Median | 9.1% | 5.6% |
| Interquartile 25% (IQ1) | 4.8% | 5.0% |
| Interquartile 75% (IQ3) | 27.6% | 7.1% |
| Interquartile Range (IQR) | 22.8% | 2.1% |
| Standard Deviation (Sample) | 24.6% | 3.0% |
| Standard Deviation (Population) | 23.7% | 3.0% |
Similar Demographics by Unemployment Among Ages 65 to 74 years
Demographics Similar to Crow by Unemployment Among Ages 65 to 74 years
In terms of unemployment among ages 65 to 74 years, the demographic groups most similar to Crow are Yup'ik (9.5%, a difference of 84.0%), Immigrants from Yemen (8.3%, a difference of 110.8%), Inupiat (7.5%, a difference of 132.3%), Alaskan Athabascan (7.4%, a difference of 136.7%), and Navajo (6.9%, a difference of 151.3%).
| Demographics | Rating | Rank | Unemployment Among Ages 65 to 74 years |
| Paiute | 0.0 /100 | #333 | Tragic 6.3% |
| Taiwanese | 0.0 /100 | #334 | Tragic 6.3% |
| Puerto Ricans | 0.0 /100 | #335 | Tragic 6.4% |
| Immigrants | Armenia | 0.0 /100 | #336 | Tragic 6.5% |
| Ute | 0.0 /100 | #337 | Tragic 6.5% |
| Tlingit-Haida | 0.0 /100 | #338 | Tragic 6.5% |
| Yakama | 0.0 /100 | #339 | Tragic 6.6% |
| Pima | 0.0 /100 | #340 | Tragic 6.6% |
| Alaska Natives | 0.0 /100 | #341 | Tragic 6.8% |
| Navajo | 0.0 /100 | #342 | Tragic 6.9% |
| Alaskan Athabascans | 0.0 /100 | #343 | Tragic 7.4% |
| Inupiat | 0.0 /100 | #344 | Tragic 7.5% |
| Immigrants | Yemen | 0.0 /100 | #345 | Tragic 8.3% |
| Yup'ik | 0.0 /100 | #346 | Tragic 9.5% |
| Crow | 0.0 /100 | #347 | Tragic 17.4% |
Demographics Similar to Blacks/African Americans by Unemployment Among Ages 65 to 74 years
In terms of unemployment among ages 65 to 74 years, the demographic groups most similar to Blacks/African Americans are Immigrants from Morocco (5.8%, a difference of 0.030%), Immigrants from Grenada (5.8%, a difference of 0.060%), U.S. Virgin Islander (5.8%, a difference of 0.16%), Portuguese (5.7%, a difference of 0.38%), and Spanish American Indian (5.7%, a difference of 0.41%).
| Demographics | Rating | Rank | Unemployment Among Ages 65 to 74 years |
| Central Americans | 0.0 /100 | #288 | Tragic 5.7% |
| Immigrants | Somalia | 0.0 /100 | #289 | Tragic 5.7% |
| Spanish American Indians | 0.0 /100 | #290 | Tragic 5.7% |
| Portuguese | 0.0 /100 | #291 | Tragic 5.7% |
| U.S. Virgin Islanders | 0.0 /100 | #292 | Tragic 5.8% |
| Immigrants | Grenada | 0.0 /100 | #293 | Tragic 5.8% |
| Immigrants | Morocco | 0.0 /100 | #294 | Tragic 5.8% |
| Blacks/African Americans | 0.0 /100 | #295 | Tragic 5.8% |
| Pennsylvania Germans | 0.0 /100 | #296 | Tragic 5.8% |
| Houma | 0.0 /100 | #297 | Tragic 5.8% |
| Immigrants | Latin America | 0.0 /100 | #298 | Tragic 5.8% |
| Barbadians | 0.0 /100 | #299 | Tragic 5.8% |
| Ecuadorians | 0.0 /100 | #300 | Tragic 5.8% |
| Armenians | 0.0 /100 | #301 | Tragic 5.8% |
| Liberians | 0.0 /100 | #302 | Tragic 5.8% |