Immigrants from Italy vs Hmong Unemployment
COMPARE
Immigrants from Italy
Hmong
Unemployment
Unemployment Comparison
Immigrants from Italy
Hmong
5.1%
UNEMPLOYMENT
79.1/ 100
METRIC RATING
148th/ 347
METRIC RANK
5.0%
UNEMPLOYMENT
97.6/ 100
METRIC RATING
83rd/ 347
METRIC RANK
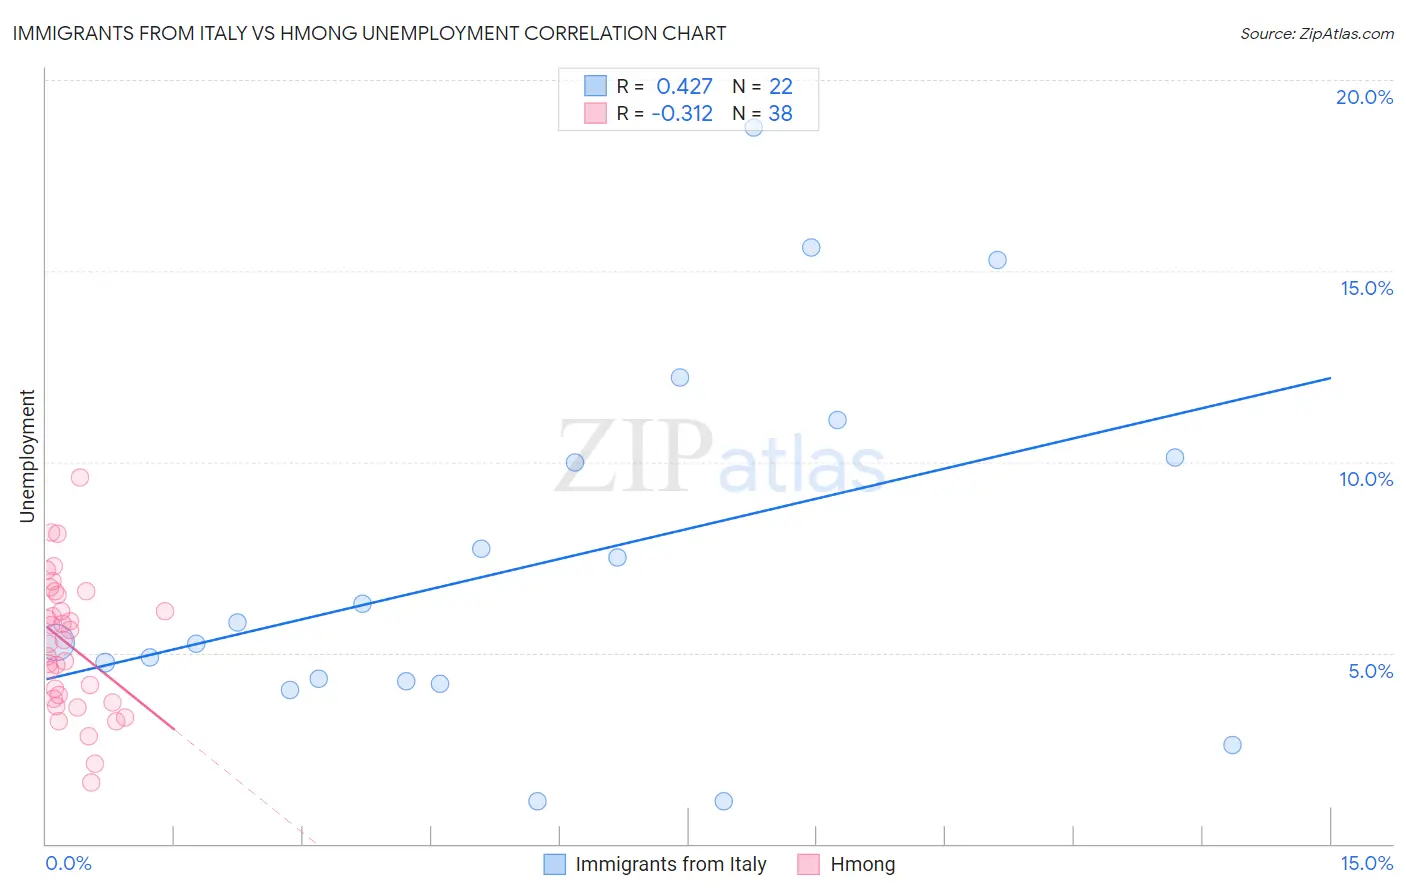
Immigrants from Italy vs Hmong Unemployment Correlation Chart
The statistical analysis conducted on geographies consisting of 324,002,453 people shows a moderate positive correlation between the proportion of Immigrants from Italy and unemployment in the United States with a correlation coefficient (R) of 0.427 and weighted average of 5.1%. Similarly, the statistical analysis conducted on geographies consisting of 24,672,093 people shows a mild negative correlation between the proportion of Hmong and unemployment in the United States with a correlation coefficient (R) of -0.312 and weighted average of 5.0%, a difference of 3.8%.
Unemployment Correlation Summary
| Measurement | Immigrants from Italy | Hmong |
| Minimum | 1.1% | 1.6% |
| Maximum | 18.8% | 9.6% |
| Range | 17.7% | 8.0% |
| Mean | 7.4% | 5.2% |
| Median | 5.5% | 5.3% |
| Interquartile 25% (IQ1) | 4.3% | 3.8% |
| Interquartile 75% (IQ3) | 10.1% | 6.5% |
| Interquartile Range (IQR) | 5.8% | 2.7% |
| Standard Deviation (Sample) | 4.8% | 1.8% |
| Standard Deviation (Population) | 4.7% | 1.7% |
Similar Demographics by Unemployment
Demographics Similar to Immigrants from Italy by Unemployment
In terms of unemployment, the demographic groups most similar to Immigrants from Italy are Syrian (5.2%, a difference of 0.13%), Indian (Asian) (5.1%, a difference of 0.26%), Potawatomi (5.2%, a difference of 0.26%), Immigrants from Norway (5.1%, a difference of 0.27%), and Immigrants from Asia (5.1%, a difference of 0.27%).
| Demographics | Rating | Rank | Unemployment |
| Palestinians | 83.4 /100 | #141 | Excellent 5.1% |
| Immigrants | Pakistan | 83.2 /100 | #142 | Excellent 5.1% |
| Immigrants | Chile | 82.8 /100 | #143 | Excellent 5.1% |
| Indonesians | 82.3 /100 | #144 | Excellent 5.1% |
| Immigrants | Norway | 81.8 /100 | #145 | Excellent 5.1% |
| Immigrants | Asia | 81.8 /100 | #146 | Excellent 5.1% |
| Indians (Asian) | 81.6 /100 | #147 | Excellent 5.1% |
| Immigrants | Italy | 79.1 /100 | #148 | Good 5.1% |
| Syrians | 77.7 /100 | #149 | Good 5.2% |
| Potawatomi | 76.2 /100 | #150 | Good 5.2% |
| Immigrants | Eastern Europe | 75.3 /100 | #151 | Good 5.2% |
| Immigrants | Hong Kong | 75.2 /100 | #152 | Good 5.2% |
| Egyptians | 75.2 /100 | #153 | Good 5.2% |
| Immigrants | China | 74.7 /100 | #154 | Good 5.2% |
| Immigrants | Northern Africa | 71.3 /100 | #155 | Good 5.2% |
Demographics Similar to Hmong by Unemployment
In terms of unemployment, the demographic groups most similar to Hmong are Fijian (5.0%, a difference of 0.010%), Basque (5.0%, a difference of 0.020%), Immigrants from Sweden (5.0%, a difference of 0.030%), Russian (5.0%, a difference of 0.080%), and Canadian (5.0%, a difference of 0.10%).
| Demographics | Rating | Rank | Unemployment |
| German Russians | 98.0 /100 | #76 | Exceptional 4.9% |
| Cypriots | 97.9 /100 | #77 | Exceptional 4.9% |
| Okinawans | 97.9 /100 | #78 | Exceptional 4.9% |
| Canadians | 97.7 /100 | #79 | Exceptional 5.0% |
| Immigrants | Sweden | 97.6 /100 | #80 | Exceptional 5.0% |
| Basques | 97.6 /100 | #81 | Exceptional 5.0% |
| Fijians | 97.6 /100 | #82 | Exceptional 5.0% |
| Hmong | 97.6 /100 | #83 | Exceptional 5.0% |
| Russians | 97.4 /100 | #84 | Exceptional 5.0% |
| Immigrants | Australia | 97.0 /100 | #85 | Exceptional 5.0% |
| Hungarians | 96.9 /100 | #86 | Exceptional 5.0% |
| Immigrants | Moldova | 96.6 /100 | #87 | Exceptional 5.0% |
| Immigrants | Korea | 96.6 /100 | #88 | Exceptional 5.0% |
| Jordanians | 96.4 /100 | #89 | Exceptional 5.0% |
| Immigrants | North Macedonia | 96.3 /100 | #90 | Exceptional 5.0% |