Immigrants from Jamaica vs Hmong Unemployment
COMPARE
Immigrants from Jamaica
Hmong
Unemployment
Unemployment Comparison
Immigrants from Jamaica
Hmong
6.4%
UNEMPLOYMENT
0.0/ 100
METRIC RATING
304th/ 347
METRIC RANK
5.0%
UNEMPLOYMENT
97.6/ 100
METRIC RATING
83rd/ 347
METRIC RANK
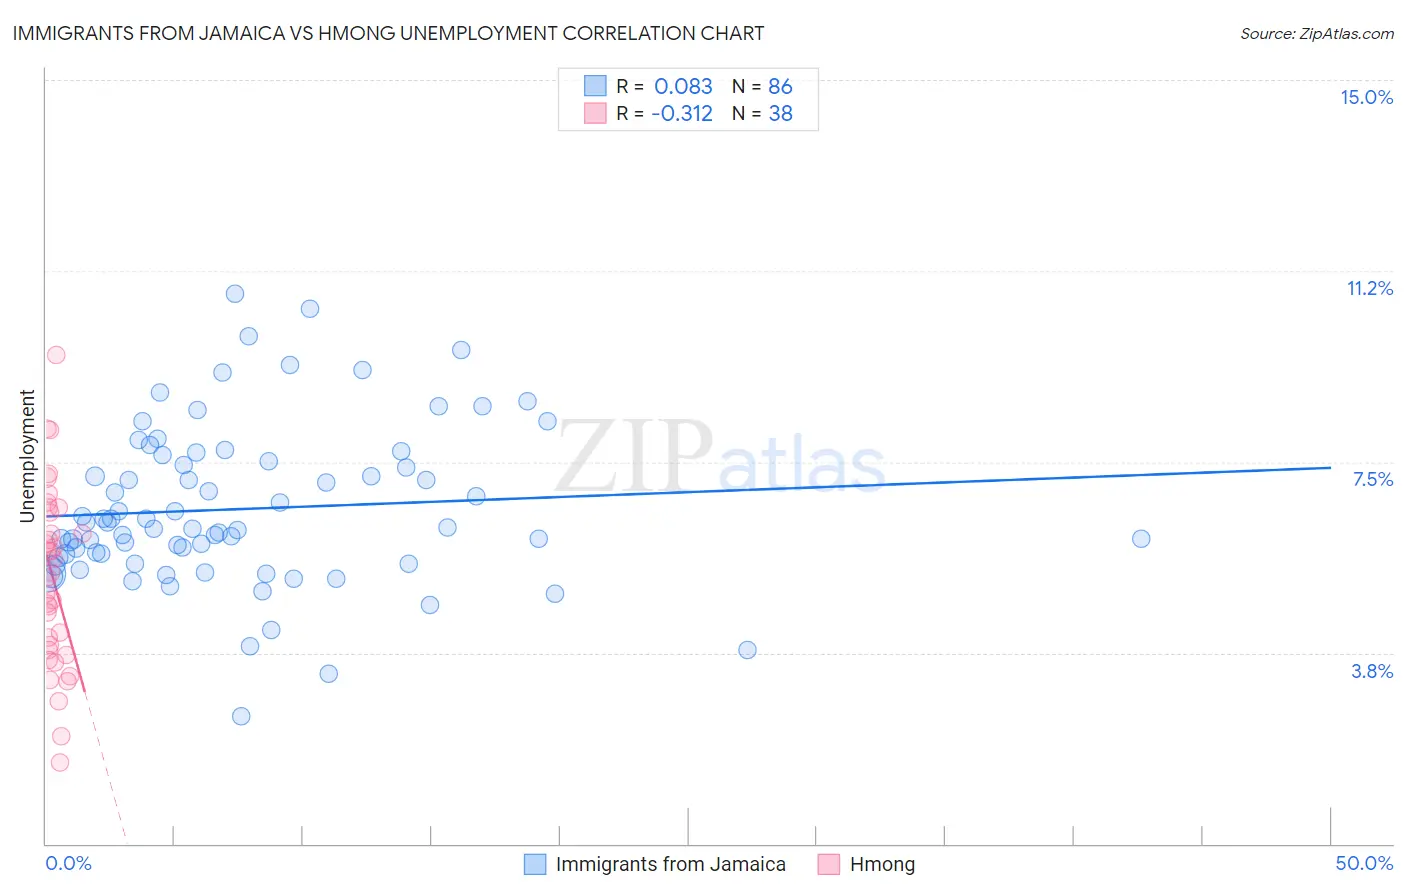
Immigrants from Jamaica vs Hmong Unemployment Correlation Chart
The statistical analysis conducted on geographies consisting of 301,587,568 people shows a slight positive correlation between the proportion of Immigrants from Jamaica and unemployment in the United States with a correlation coefficient (R) of 0.083 and weighted average of 6.4%. Similarly, the statistical analysis conducted on geographies consisting of 24,672,093 people shows a mild negative correlation between the proportion of Hmong and unemployment in the United States with a correlation coefficient (R) of -0.312 and weighted average of 5.0%, a difference of 29.5%.
Unemployment Correlation Summary
| Measurement | Immigrants from Jamaica | Hmong |
| Minimum | 2.5% | 1.6% |
| Maximum | 10.8% | 9.6% |
| Range | 8.3% | 8.0% |
| Mean | 6.6% | 5.2% |
| Median | 6.2% | 5.3% |
| Interquartile 25% (IQ1) | 5.6% | 3.8% |
| Interquartile 75% (IQ3) | 7.5% | 6.5% |
| Interquartile Range (IQR) | 1.9% | 2.7% |
| Standard Deviation (Sample) | 1.6% | 1.8% |
| Standard Deviation (Population) | 1.6% | 1.7% |
Similar Demographics by Unemployment
Demographics Similar to Immigrants from Jamaica by Unemployment
In terms of unemployment, the demographic groups most similar to Immigrants from Jamaica are Menominee (6.4%, a difference of 0.25%), Lumbee (6.4%, a difference of 0.29%), Belizean (6.4%, a difference of 0.68%), Immigrants from Bangladesh (6.5%, a difference of 0.77%), and West Indian (6.4%, a difference of 0.91%).
| Demographics | Rating | Rank | Unemployment |
| Jamaicans | 0.0 /100 | #297 | Tragic 6.3% |
| Immigrants | Haiti | 0.0 /100 | #298 | Tragic 6.3% |
| Immigrants | West Indies | 0.0 /100 | #299 | Tragic 6.3% |
| Immigrants | Trinidad and Tobago | 0.0 /100 | #300 | Tragic 6.3% |
| Trinidadians and Tobagonians | 0.0 /100 | #301 | Tragic 6.3% |
| West Indians | 0.0 /100 | #302 | Tragic 6.4% |
| Belizeans | 0.0 /100 | #303 | Tragic 6.4% |
| Immigrants | Jamaica | 0.0 /100 | #304 | Tragic 6.4% |
| Menominee | 0.0 /100 | #305 | Tragic 6.4% |
| Lumbee | 0.0 /100 | #306 | Tragic 6.4% |
| Immigrants | Bangladesh | 0.0 /100 | #307 | Tragic 6.5% |
| Barbadians | 0.0 /100 | #308 | Tragic 6.5% |
| Vietnamese | 0.0 /100 | #309 | Tragic 6.5% |
| Immigrants | Belize | 0.0 /100 | #310 | Tragic 6.5% |
| Cape Verdeans | 0.0 /100 | #311 | Tragic 6.5% |
Demographics Similar to Hmong by Unemployment
In terms of unemployment, the demographic groups most similar to Hmong are Fijian (5.0%, a difference of 0.010%), Basque (5.0%, a difference of 0.020%), Immigrants from Sweden (5.0%, a difference of 0.030%), Russian (5.0%, a difference of 0.080%), and Canadian (5.0%, a difference of 0.10%).
| Demographics | Rating | Rank | Unemployment |
| German Russians | 98.0 /100 | #76 | Exceptional 4.9% |
| Cypriots | 97.9 /100 | #77 | Exceptional 4.9% |
| Okinawans | 97.9 /100 | #78 | Exceptional 4.9% |
| Canadians | 97.7 /100 | #79 | Exceptional 5.0% |
| Immigrants | Sweden | 97.6 /100 | #80 | Exceptional 5.0% |
| Basques | 97.6 /100 | #81 | Exceptional 5.0% |
| Fijians | 97.6 /100 | #82 | Exceptional 5.0% |
| Hmong | 97.6 /100 | #83 | Exceptional 5.0% |
| Russians | 97.4 /100 | #84 | Exceptional 5.0% |
| Immigrants | Australia | 97.0 /100 | #85 | Exceptional 5.0% |
| Hungarians | 96.9 /100 | #86 | Exceptional 5.0% |
| Immigrants | Moldova | 96.6 /100 | #87 | Exceptional 5.0% |
| Immigrants | Korea | 96.6 /100 | #88 | Exceptional 5.0% |
| Jordanians | 96.4 /100 | #89 | Exceptional 5.0% |
| Immigrants | North Macedonia | 96.3 /100 | #90 | Exceptional 5.0% |