Immigrants from Israel vs Immigrants from Sweden Unemployment Among Ages 16 to 19 years
COMPARE
Immigrants from Israel
Immigrants from Sweden
Unemployment Among Ages 16 to 19 years
Unemployment Among Ages 16 to 19 years Comparison
Immigrants from Israel
Immigrants from Sweden
18.7%
UNEMPLOYMENT AMONG AGES 16 TO 19 YEARS
0.5/ 100
METRIC RATING
247th/ 347
METRIC RANK
17.6%
UNEMPLOYMENT AMONG AGES 16 TO 19 YEARS
49.1/ 100
METRIC RATING
175th/ 347
METRIC RANK
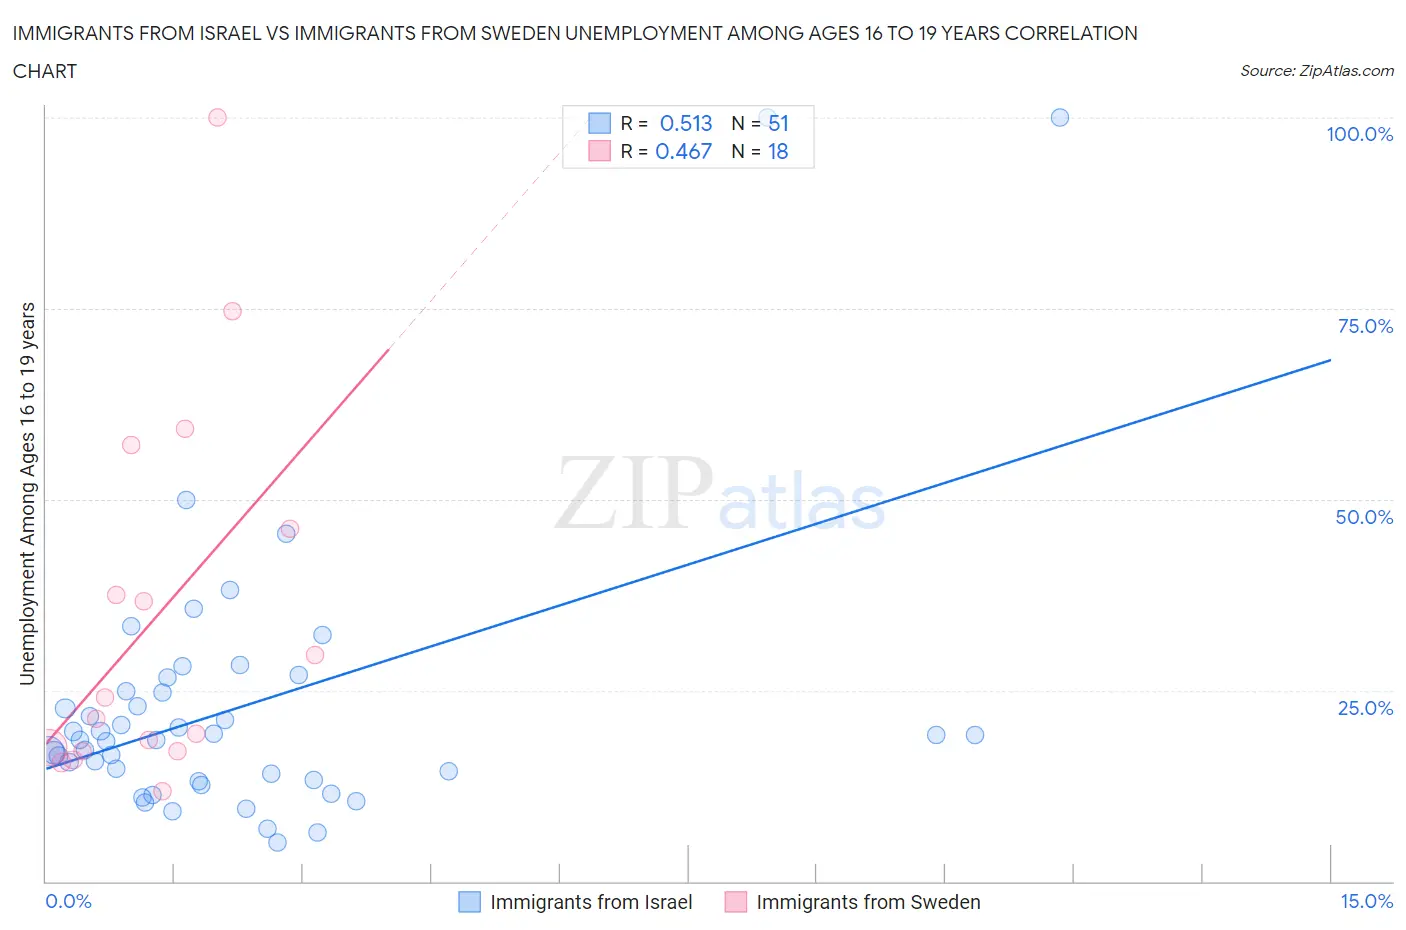
Immigrants from Israel vs Immigrants from Sweden Unemployment Among Ages 16 to 19 years Correlation Chart
The statistical analysis conducted on geographies consisting of 202,743,989 people shows a substantial positive correlation between the proportion of Immigrants from Israel and unemployment rate among population between the ages 16 and 19 in the United States with a correlation coefficient (R) of 0.513 and weighted average of 18.7%. Similarly, the statistical analysis conducted on geographies consisting of 159,357,734 people shows a moderate positive correlation between the proportion of Immigrants from Sweden and unemployment rate among population between the ages 16 and 19 in the United States with a correlation coefficient (R) of 0.467 and weighted average of 17.6%, a difference of 6.2%.
Unemployment Among Ages 16 to 19 years Correlation Summary
| Measurement | Immigrants from Israel | Immigrants from Sweden |
| Minimum | 5.1% | 11.8% |
| Maximum | 100.0% | 100.0% |
| Range | 94.9% | 88.2% |
| Mean | 22.8% | 34.4% |
| Median | 18.6% | 22.7% |
| Interquartile 25% (IQ1) | 13.3% | 17.1% |
| Interquartile 75% (IQ3) | 24.8% | 46.2% |
| Interquartile Range (IQR) | 11.5% | 29.1% |
| Standard Deviation (Sample) | 18.3% | 24.4% |
| Standard Deviation (Population) | 18.1% | 23.7% |
Similar Demographics by Unemployment Among Ages 16 to 19 years
Demographics Similar to Immigrants from Israel by Unemployment Among Ages 16 to 19 years
In terms of unemployment among ages 16 to 19 years, the demographic groups most similar to Immigrants from Israel are Delaware (18.7%, a difference of 0.030%), Immigrants from South America (18.7%, a difference of 0.040%), Puget Sound Salish (18.7%, a difference of 0.090%), Panamanian (18.7%, a difference of 0.20%), and Subsaharan African (18.7%, a difference of 0.31%).
| Demographics | Rating | Rank | Unemployment Among Ages 16 to 19 years |
| Immigrants | Cabo Verde | 2.0 /100 | #240 | Tragic 18.4% |
| Immigrants | Ukraine | 1.3 /100 | #241 | Tragic 18.5% |
| Moroccans | 1.1 /100 | #242 | Tragic 18.5% |
| Mexicans | 0.9 /100 | #243 | Tragic 18.5% |
| Guatemalans | 0.8 /100 | #244 | Tragic 18.6% |
| Immigrants | Belarus | 0.8 /100 | #245 | Tragic 18.6% |
| Immigrants | South America | 0.5 /100 | #246 | Tragic 18.7% |
| Immigrants | Israel | 0.5 /100 | #247 | Tragic 18.7% |
| Delaware | 0.5 /100 | #248 | Tragic 18.7% |
| Puget Sound Salish | 0.5 /100 | #249 | Tragic 18.7% |
| Panamanians | 0.4 /100 | #250 | Tragic 18.7% |
| Sub-Saharan Africans | 0.4 /100 | #251 | Tragic 18.7% |
| Immigrants | Guatemala | 0.4 /100 | #252 | Tragic 18.7% |
| Central Americans | 0.3 /100 | #253 | Tragic 18.8% |
| Apache | 0.3 /100 | #254 | Tragic 18.8% |
Demographics Similar to Immigrants from Sweden by Unemployment Among Ages 16 to 19 years
In terms of unemployment among ages 16 to 19 years, the demographic groups most similar to Immigrants from Sweden are Nicaraguan (17.6%, a difference of 0.010%), Bermudan (17.6%, a difference of 0.020%), Celtic (17.6%, a difference of 0.020%), Osage (17.6%, a difference of 0.040%), and Chilean (17.6%, a difference of 0.080%).
| Demographics | Rating | Rank | Unemployment Among Ages 16 to 19 years |
| Immigrants | Hungary | 54.7 /100 | #168 | Average 17.5% |
| Immigrants | Cambodia | 54.5 /100 | #169 | Average 17.5% |
| Immigrants | Romania | 53.3 /100 | #170 | Average 17.5% |
| Immigrants | Switzerland | 53.2 /100 | #171 | Average 17.5% |
| Immigrants | Western Europe | 52.2 /100 | #172 | Average 17.6% |
| Chileans | 50.8 /100 | #173 | Average 17.6% |
| Osage | 50.0 /100 | #174 | Average 17.6% |
| Immigrants | Sweden | 49.1 /100 | #175 | Average 17.6% |
| Nicaraguans | 48.9 /100 | #176 | Average 17.6% |
| Bermudans | 48.7 /100 | #177 | Average 17.6% |
| Celtics | 48.7 /100 | #178 | Average 17.6% |
| Americans | 47.4 /100 | #179 | Average 17.6% |
| Spaniards | 47.1 /100 | #180 | Average 17.6% |
| Immigrants | Turkey | 45.6 /100 | #181 | Average 17.6% |
| Russians | 45.2 /100 | #182 | Average 17.6% |