Immigrants from Israel vs Immigrants from Moldova Unemployment Among Ages 16 to 19 years
COMPARE
Immigrants from Israel
Immigrants from Moldova
Unemployment Among Ages 16 to 19 years
Unemployment Among Ages 16 to 19 years Comparison
Immigrants from Israel
Immigrants from Moldova
18.7%
UNEMPLOYMENT AMONG AGES 16 TO 19 YEARS
0.5/ 100
METRIC RATING
247th/ 347
METRIC RANK
17.1%
UNEMPLOYMENT AMONG AGES 16 TO 19 YEARS
90.7/ 100
METRIC RATING
121st/ 347
METRIC RANK
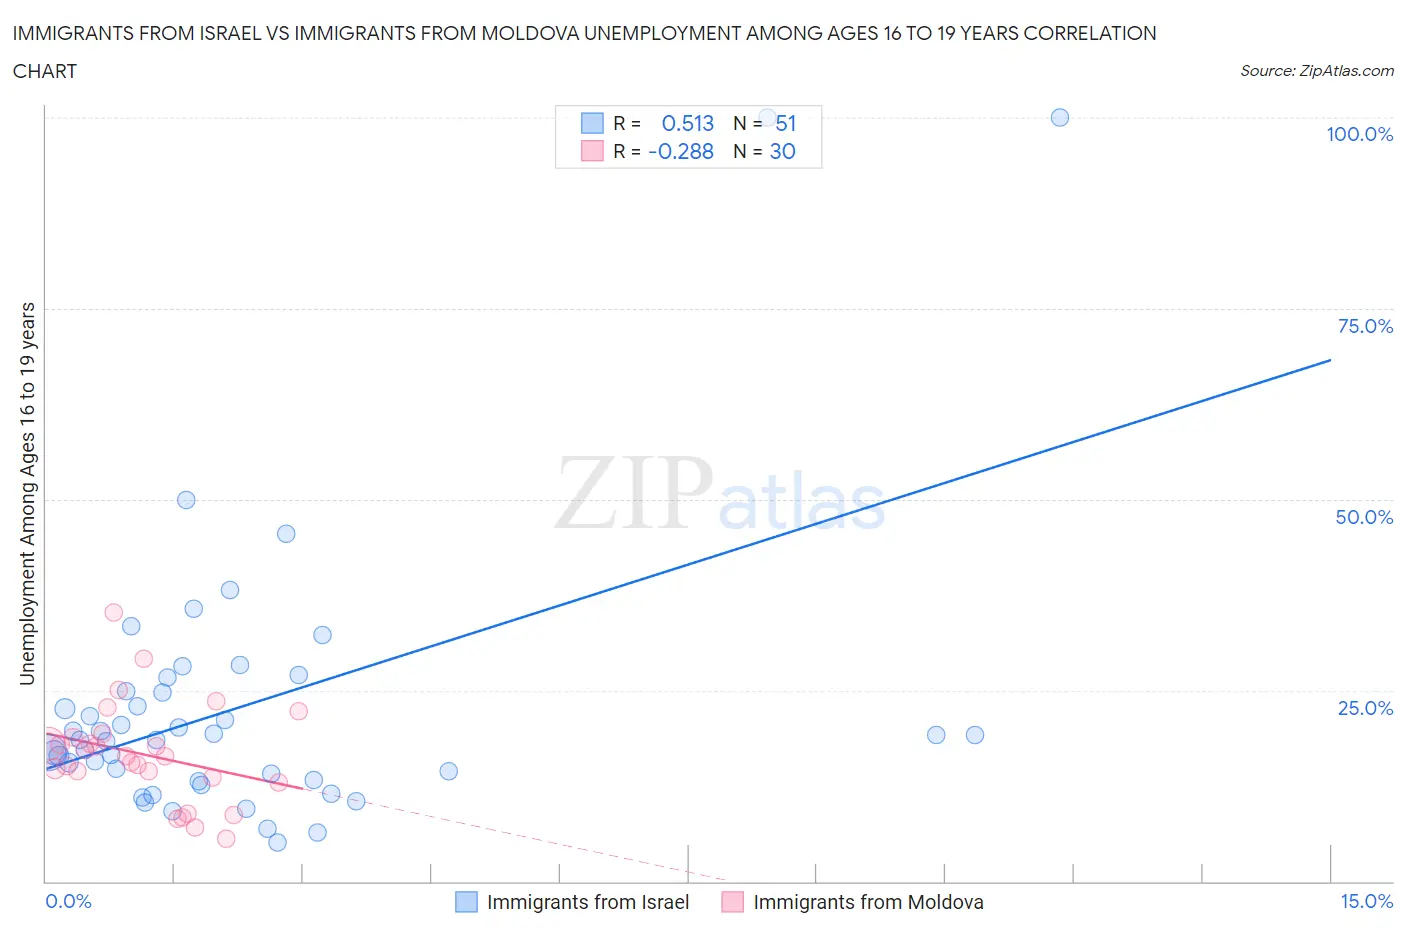
Immigrants from Israel vs Immigrants from Moldova Unemployment Among Ages 16 to 19 years Correlation Chart
The statistical analysis conducted on geographies consisting of 202,743,989 people shows a substantial positive correlation between the proportion of Immigrants from Israel and unemployment rate among population between the ages 16 and 19 in the United States with a correlation coefficient (R) of 0.513 and weighted average of 18.7%. Similarly, the statistical analysis conducted on geographies consisting of 121,441,802 people shows a weak negative correlation between the proportion of Immigrants from Moldova and unemployment rate among population between the ages 16 and 19 in the United States with a correlation coefficient (R) of -0.288 and weighted average of 17.1%, a difference of 9.2%.
Unemployment Among Ages 16 to 19 years Correlation Summary
| Measurement | Immigrants from Israel | Immigrants from Moldova |
| Minimum | 5.1% | 5.6% |
| Maximum | 100.0% | 35.3% |
| Range | 94.9% | 29.7% |
| Mean | 22.8% | 16.6% |
| Median | 18.6% | 16.4% |
| Interquartile 25% (IQ1) | 13.3% | 13.6% |
| Interquartile 75% (IQ3) | 24.8% | 18.8% |
| Interquartile Range (IQR) | 11.5% | 5.2% |
| Standard Deviation (Sample) | 18.3% | 6.5% |
| Standard Deviation (Population) | 18.1% | 6.4% |
Similar Demographics by Unemployment Among Ages 16 to 19 years
Demographics Similar to Immigrants from Israel by Unemployment Among Ages 16 to 19 years
In terms of unemployment among ages 16 to 19 years, the demographic groups most similar to Immigrants from Israel are Delaware (18.7%, a difference of 0.030%), Immigrants from South America (18.7%, a difference of 0.040%), Puget Sound Salish (18.7%, a difference of 0.090%), Panamanian (18.7%, a difference of 0.20%), and Subsaharan African (18.7%, a difference of 0.31%).
| Demographics | Rating | Rank | Unemployment Among Ages 16 to 19 years |
| Immigrants | Cabo Verde | 2.0 /100 | #240 | Tragic 18.4% |
| Immigrants | Ukraine | 1.3 /100 | #241 | Tragic 18.5% |
| Moroccans | 1.1 /100 | #242 | Tragic 18.5% |
| Mexicans | 0.9 /100 | #243 | Tragic 18.5% |
| Guatemalans | 0.8 /100 | #244 | Tragic 18.6% |
| Immigrants | Belarus | 0.8 /100 | #245 | Tragic 18.6% |
| Immigrants | South America | 0.5 /100 | #246 | Tragic 18.7% |
| Immigrants | Israel | 0.5 /100 | #247 | Tragic 18.7% |
| Delaware | 0.5 /100 | #248 | Tragic 18.7% |
| Puget Sound Salish | 0.5 /100 | #249 | Tragic 18.7% |
| Panamanians | 0.4 /100 | #250 | Tragic 18.7% |
| Sub-Saharan Africans | 0.4 /100 | #251 | Tragic 18.7% |
| Immigrants | Guatemala | 0.4 /100 | #252 | Tragic 18.7% |
| Central Americans | 0.3 /100 | #253 | Tragic 18.8% |
| Apache | 0.3 /100 | #254 | Tragic 18.8% |
Demographics Similar to Immigrants from Moldova by Unemployment Among Ages 16 to 19 years
In terms of unemployment among ages 16 to 19 years, the demographic groups most similar to Immigrants from Moldova are Immigrants from South Eastern Asia (17.1%, a difference of 0.010%), Immigrants from Middle Africa (17.1%, a difference of 0.020%), Hungarian (17.1%, a difference of 0.13%), Venezuelan (17.1%, a difference of 0.17%), and Immigrants from Sri Lanka (17.1%, a difference of 0.19%).
| Demographics | Rating | Rank | Unemployment Among Ages 16 to 19 years |
| Immigrants | Poland | 93.1 /100 | #114 | Exceptional 17.0% |
| Brazilians | 92.3 /100 | #115 | Exceptional 17.1% |
| Immigrants | Korea | 92.2 /100 | #116 | Exceptional 17.1% |
| Immigrants | Sri Lanka | 92.0 /100 | #117 | Exceptional 17.1% |
| Venezuelans | 91.8 /100 | #118 | Exceptional 17.1% |
| Hungarians | 91.6 /100 | #119 | Exceptional 17.1% |
| Immigrants | Middle Africa | 90.9 /100 | #120 | Exceptional 17.1% |
| Immigrants | Moldova | 90.7 /100 | #121 | Exceptional 17.1% |
| Immigrants | South Eastern Asia | 90.7 /100 | #122 | Exceptional 17.1% |
| Immigrants | Laos | 88.8 /100 | #123 | Excellent 17.1% |
| Syrians | 88.6 /100 | #124 | Excellent 17.1% |
| Immigrants | Germany | 87.7 /100 | #125 | Excellent 17.2% |
| Immigrants | Bolivia | 86.7 /100 | #126 | Excellent 17.2% |
| Pakistanis | 85.8 /100 | #127 | Excellent 17.2% |
| Australians | 85.6 /100 | #128 | Excellent 17.2% |