Immigrants from Armenia vs Immigrants from Moldova Unemployment Among Ages 16 to 19 years
COMPARE
Immigrants from Armenia
Immigrants from Moldova
Unemployment Among Ages 16 to 19 years
Unemployment Among Ages 16 to 19 years Comparison
Immigrants from Armenia
Immigrants from Moldova
22.6%
UNEMPLOYMENT AMONG AGES 16 TO 19 YEARS
0.0/ 100
METRIC RATING
324th/ 347
METRIC RANK
17.1%
UNEMPLOYMENT AMONG AGES 16 TO 19 YEARS
90.7/ 100
METRIC RATING
121st/ 347
METRIC RANK
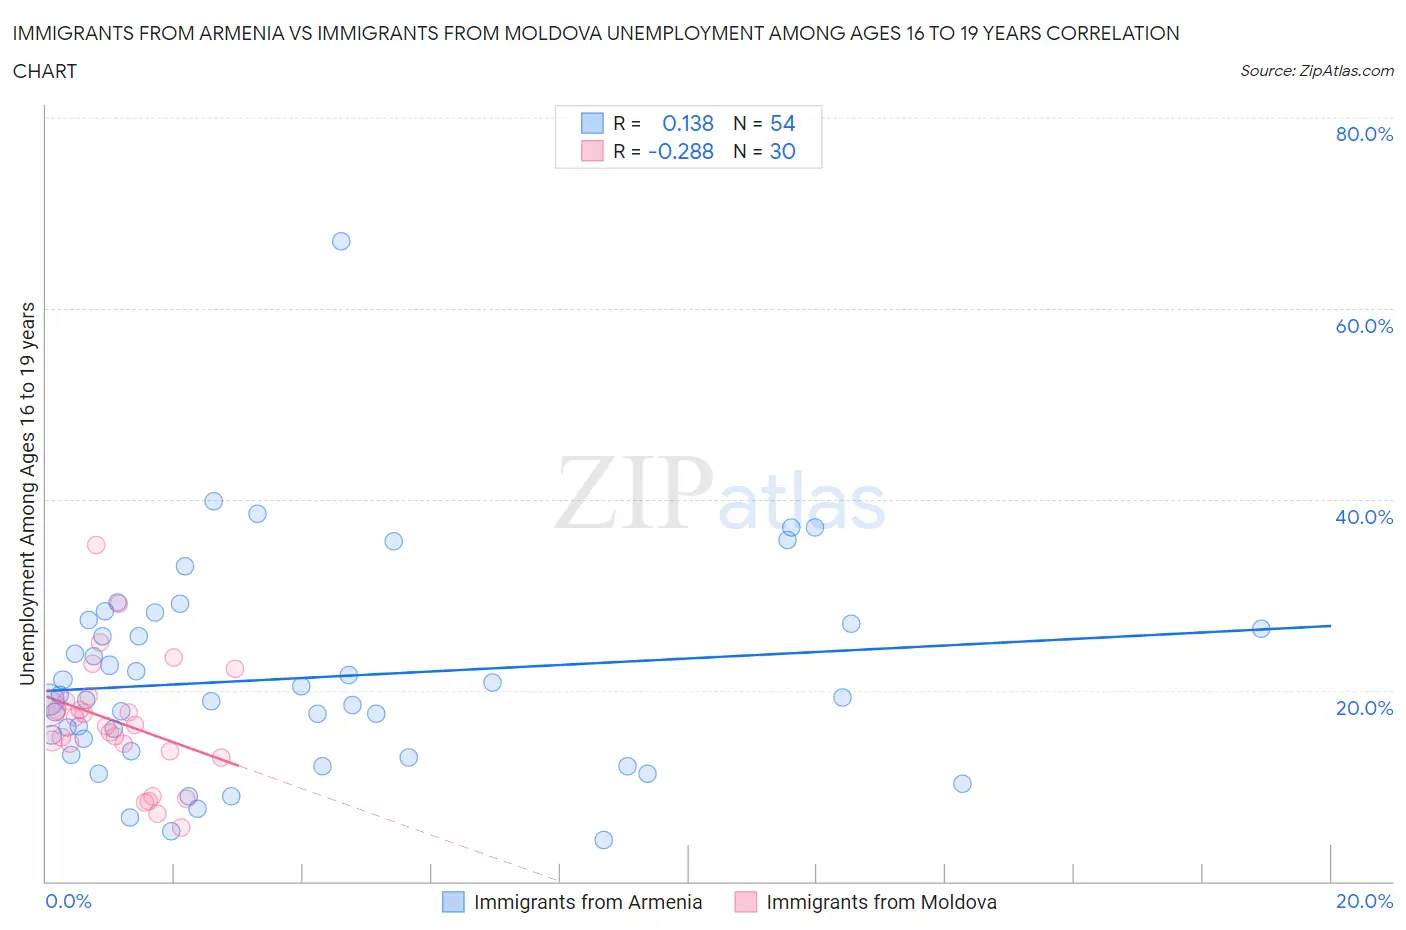
Immigrants from Armenia vs Immigrants from Moldova Unemployment Among Ages 16 to 19 years Correlation Chart
The statistical analysis conducted on geographies consisting of 95,580,744 people shows a poor positive correlation between the proportion of Immigrants from Armenia and unemployment rate among population between the ages 16 and 19 in the United States with a correlation coefficient (R) of 0.138 and weighted average of 22.6%. Similarly, the statistical analysis conducted on geographies consisting of 121,441,802 people shows a weak negative correlation between the proportion of Immigrants from Moldova and unemployment rate among population between the ages 16 and 19 in the United States with a correlation coefficient (R) of -0.288 and weighted average of 17.1%, a difference of 32.2%.
Unemployment Among Ages 16 to 19 years Correlation Summary
| Measurement | Immigrants from Armenia | Immigrants from Moldova |
| Minimum | 4.3% | 5.6% |
| Maximum | 67.0% | 35.3% |
| Range | 62.7% | 29.7% |
| Mean | 21.3% | 16.6% |
| Median | 19.2% | 16.4% |
| Interquartile 25% (IQ1) | 13.6% | 13.6% |
| Interquartile 75% (IQ3) | 27.0% | 18.8% |
| Interquartile Range (IQR) | 13.4% | 5.2% |
| Standard Deviation (Sample) | 10.9% | 6.5% |
| Standard Deviation (Population) | 10.8% | 6.4% |
Similar Demographics by Unemployment Among Ages 16 to 19 years
Demographics Similar to Immigrants from Armenia by Unemployment Among Ages 16 to 19 years
In terms of unemployment among ages 16 to 19 years, the demographic groups most similar to Immigrants from Armenia are Trinidadian and Tobagonian (22.6%, a difference of 0.12%), Yakama (22.5%, a difference of 0.45%), Barbadian (22.5%, a difference of 0.68%), West Indian (22.4%, a difference of 0.81%), and Cheyenne (22.3%, a difference of 1.5%).
| Demographics | Rating | Rank | Unemployment Among Ages 16 to 19 years |
| Immigrants | Belize | 0.0 /100 | #317 | Tragic 22.2% |
| Immigrants | Jamaica | 0.0 /100 | #318 | Tragic 22.2% |
| Immigrants | West Indies | 0.0 /100 | #319 | Tragic 22.2% |
| Cheyenne | 0.0 /100 | #320 | Tragic 22.3% |
| West Indians | 0.0 /100 | #321 | Tragic 22.4% |
| Barbadians | 0.0 /100 | #322 | Tragic 22.5% |
| Yakama | 0.0 /100 | #323 | Tragic 22.5% |
| Immigrants | Armenia | 0.0 /100 | #324 | Tragic 22.6% |
| Trinidadians and Tobagonians | 0.0 /100 | #325 | Tragic 22.6% |
| Immigrants | Trinidad and Tobago | 0.0 /100 | #326 | Tragic 23.1% |
| Pima | 0.0 /100 | #327 | Tragic 23.1% |
| Immigrants | Dominican Republic | 0.0 /100 | #328 | Tragic 23.3% |
| Tlingit-Haida | 0.0 /100 | #329 | Tragic 23.5% |
| Dominicans | 0.0 /100 | #330 | Tragic 23.6% |
| British West Indians | 0.0 /100 | #331 | Tragic 24.0% |
Demographics Similar to Immigrants from Moldova by Unemployment Among Ages 16 to 19 years
In terms of unemployment among ages 16 to 19 years, the demographic groups most similar to Immigrants from Moldova are Immigrants from South Eastern Asia (17.1%, a difference of 0.010%), Immigrants from Middle Africa (17.1%, a difference of 0.020%), Hungarian (17.1%, a difference of 0.13%), Venezuelan (17.1%, a difference of 0.17%), and Immigrants from Sri Lanka (17.1%, a difference of 0.19%).
| Demographics | Rating | Rank | Unemployment Among Ages 16 to 19 years |
| Immigrants | Poland | 93.1 /100 | #114 | Exceptional 17.0% |
| Brazilians | 92.3 /100 | #115 | Exceptional 17.1% |
| Immigrants | Korea | 92.2 /100 | #116 | Exceptional 17.1% |
| Immigrants | Sri Lanka | 92.0 /100 | #117 | Exceptional 17.1% |
| Venezuelans | 91.8 /100 | #118 | Exceptional 17.1% |
| Hungarians | 91.6 /100 | #119 | Exceptional 17.1% |
| Immigrants | Middle Africa | 90.9 /100 | #120 | Exceptional 17.1% |
| Immigrants | Moldova | 90.7 /100 | #121 | Exceptional 17.1% |
| Immigrants | South Eastern Asia | 90.7 /100 | #122 | Exceptional 17.1% |
| Immigrants | Laos | 88.8 /100 | #123 | Excellent 17.1% |
| Syrians | 88.6 /100 | #124 | Excellent 17.1% |
| Immigrants | Germany | 87.7 /100 | #125 | Excellent 17.2% |
| Immigrants | Bolivia | 86.7 /100 | #126 | Excellent 17.2% |
| Pakistanis | 85.8 /100 | #127 | Excellent 17.2% |
| Australians | 85.6 /100 | #128 | Excellent 17.2% |