Hispanic or Latino vs German Russian Unemployment Among Ages 55 to 59 years
COMPARE
Hispanic or Latino
German Russian
Unemployment Among Ages 55 to 59 years
Unemployment Among Ages 55 to 59 years Comparison
Hispanics or Latinos
German Russians
5.4%
UNEMPLOYMENT AMONG AGES 55 TO 59 YEARS
0.0/ 100
METRIC RATING
298th/ 347
METRIC RANK
4.5%
UNEMPLOYMENT AMONG AGES 55 TO 59 YEARS
99.8/ 100
METRIC RATING
47th/ 347
METRIC RANK
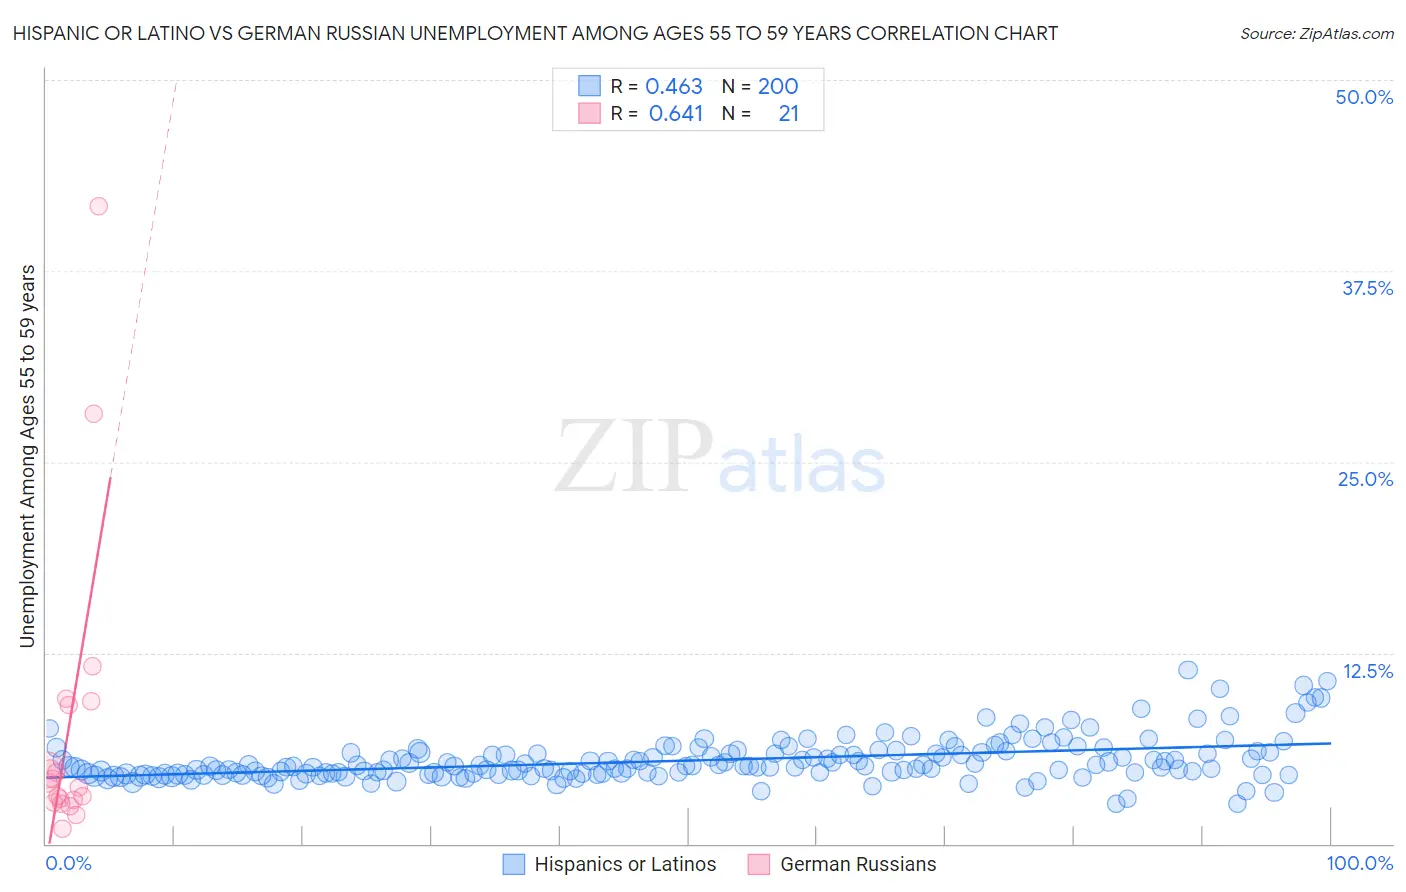
Hispanic or Latino vs German Russian Unemployment Among Ages 55 to 59 years Correlation Chart
The statistical analysis conducted on geographies consisting of 491,082,633 people shows a moderate positive correlation between the proportion of Hispanics or Latinos and unemployment rate among population between the ages 55 and 59 in the United States with a correlation coefficient (R) of 0.463 and weighted average of 5.4%. Similarly, the statistical analysis conducted on geographies consisting of 93,561,561 people shows a significant positive correlation between the proportion of German Russians and unemployment rate among population between the ages 55 and 59 in the United States with a correlation coefficient (R) of 0.641 and weighted average of 4.5%, a difference of 18.7%.
Unemployment Among Ages 55 to 59 years Correlation Summary
| Measurement | Hispanic or Latino | German Russian |
| Minimum | 2.6% | 0.96% |
| Maximum | 11.4% | 41.7% |
| Range | 8.7% | 40.7% |
| Mean | 5.4% | 7.5% |
| Median | 5.1% | 4.0% |
| Interquartile 25% (IQ1) | 4.6% | 2.8% |
| Interquartile 75% (IQ3) | 5.9% | 9.2% |
| Interquartile Range (IQR) | 1.4% | 6.4% |
| Standard Deviation (Sample) | 1.4% | 9.8% |
| Standard Deviation (Population) | 1.4% | 9.5% |
Similar Demographics by Unemployment Among Ages 55 to 59 years
Demographics Similar to Hispanics or Latinos by Unemployment Among Ages 55 to 59 years
In terms of unemployment among ages 55 to 59 years, the demographic groups most similar to Hispanics or Latinos are Immigrants from Mexico (5.3%, a difference of 0.38%), Barbadian (5.3%, a difference of 0.60%), Dutch West Indian (5.3%, a difference of 0.64%), Cajun (5.3%, a difference of 0.76%), and Immigrants from Grenada (5.3%, a difference of 0.88%).
| Demographics | Rating | Rank | Unemployment Among Ages 55 to 59 years |
| Trinidadians and Tobagonians | 0.0 /100 | #291 | Tragic 5.3% |
| British West Indians | 0.0 /100 | #292 | Tragic 5.3% |
| Immigrants | Grenada | 0.0 /100 | #293 | Tragic 5.3% |
| Cajuns | 0.0 /100 | #294 | Tragic 5.3% |
| Dutch West Indians | 0.0 /100 | #295 | Tragic 5.3% |
| Barbadians | 0.0 /100 | #296 | Tragic 5.3% |
| Immigrants | Mexico | 0.0 /100 | #297 | Tragic 5.3% |
| Hispanics or Latinos | 0.0 /100 | #298 | Tragic 5.4% |
| Cape Verdeans | 0.0 /100 | #299 | Tragic 5.4% |
| Immigrants | St. Vincent and the Grenadines | 0.0 /100 | #300 | Tragic 5.4% |
| Immigrants | Dominica | 0.0 /100 | #301 | Tragic 5.5% |
| Sierra Leoneans | 0.0 /100 | #302 | Tragic 5.5% |
| Marshallese | 0.0 /100 | #303 | Tragic 5.5% |
| Blacks/African Americans | 0.0 /100 | #304 | Tragic 5.5% |
| Immigrants | Portugal | 0.0 /100 | #305 | Tragic 5.5% |
Demographics Similar to German Russians by Unemployment Among Ages 55 to 59 years
In terms of unemployment among ages 55 to 59 years, the demographic groups most similar to German Russians are Immigrants from Zaire (4.5%, a difference of 0.060%), British (4.5%, a difference of 0.080%), Immigrants from Korea (4.5%, a difference of 0.15%), European (4.5%, a difference of 0.15%), and Immigrants from Kuwait (4.5%, a difference of 0.19%).
| Demographics | Rating | Rank | Unemployment Among Ages 55 to 59 years |
| Swiss | 99.8 /100 | #40 | Exceptional 4.5% |
| Luxembourgers | 99.8 /100 | #41 | Exceptional 4.5% |
| Immigrants | Kuwait | 99.8 /100 | #42 | Exceptional 4.5% |
| Immigrants | Korea | 99.8 /100 | #43 | Exceptional 4.5% |
| Europeans | 99.8 /100 | #44 | Exceptional 4.5% |
| British | 99.8 /100 | #45 | Exceptional 4.5% |
| Immigrants | Zaire | 99.8 /100 | #46 | Exceptional 4.5% |
| German Russians | 99.8 /100 | #47 | Exceptional 4.5% |
| Immigrants | Moldova | 99.7 /100 | #48 | Exceptional 4.5% |
| Immigrants | Saudi Arabia | 99.7 /100 | #49 | Exceptional 4.5% |
| Immigrants | Pakistan | 99.7 /100 | #50 | Exceptional 4.5% |
| Maltese | 99.7 /100 | #51 | Exceptional 4.5% |
| Scottish | 99.7 /100 | #52 | Exceptional 4.5% |
| Immigrants | Middle Africa | 99.7 /100 | #53 | Exceptional 4.5% |
| Burmese | 99.7 /100 | #54 | Exceptional 4.5% |