Immigrants from Iraq vs Chippewa Unemployment Among Women with Children Under 18 years
COMPARE
Immigrants from Iraq
Chippewa
Unemployment Among Women with Children Under 18 years
Unemployment Among Women with Children Under 18 years Comparison
Immigrants from Iraq
Chippewa
5.4%
UNEMPLOYMENT AMONG WOMEN WITH CHILDREN UNDER 18 YEARS
65.9/ 100
METRIC RATING
161st/ 347
METRIC RANK
7.0%
UNEMPLOYMENT AMONG WOMEN WITH CHILDREN UNDER 18 YEARS
0.0/ 100
METRIC RATING
326th/ 347
METRIC RANK
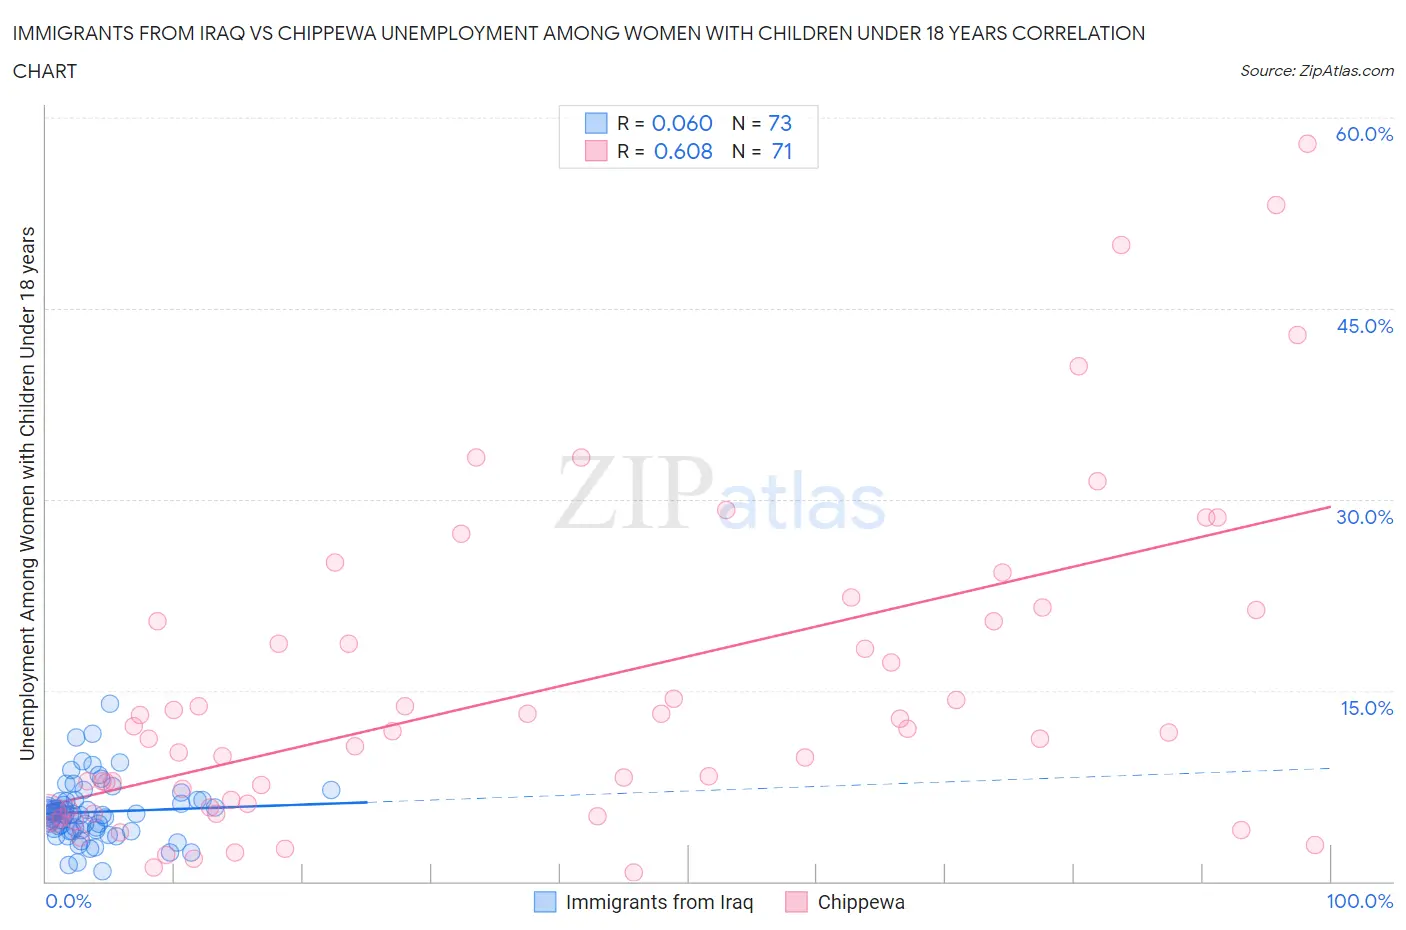
Immigrants from Iraq vs Chippewa Unemployment Among Women with Children Under 18 years Correlation Chart
The statistical analysis conducted on geographies consisting of 191,741,765 people shows a slight positive correlation between the proportion of Immigrants from Iraq and unemployment rate among women with children under the age of 18 in the United States with a correlation coefficient (R) of 0.060 and weighted average of 5.4%. Similarly, the statistical analysis conducted on geographies consisting of 207,005,580 people shows a significant positive correlation between the proportion of Chippewa and unemployment rate among women with children under the age of 18 in the United States with a correlation coefficient (R) of 0.608 and weighted average of 7.0%, a difference of 30.5%.
Unemployment Among Women with Children Under 18 years Correlation Summary
| Measurement | Immigrants from Iraq | Chippewa |
| Minimum | 0.80% | 0.70% |
| Maximum | 13.9% | 57.9% |
| Range | 13.1% | 57.2% |
| Mean | 5.4% | 15.0% |
| Median | 5.3% | 11.7% |
| Interquartile 25% (IQ1) | 4.0% | 5.7% |
| Interquartile 75% (IQ3) | 6.4% | 20.5% |
| Interquartile Range (IQR) | 2.3% | 14.7% |
| Standard Deviation (Sample) | 2.3% | 12.7% |
| Standard Deviation (Population) | 2.3% | 12.6% |
Similar Demographics by Unemployment Among Women with Children Under 18 years
Demographics Similar to Immigrants from Iraq by Unemployment Among Women with Children Under 18 years
In terms of unemployment among women with children under 18 years, the demographic groups most similar to Immigrants from Iraq are Afghan (5.4%, a difference of 0.050%), Immigrants from Saudi Arabia (5.4%, a difference of 0.070%), Lebanese (5.4%, a difference of 0.10%), Chickasaw (5.4%, a difference of 0.21%), and Celtic (5.4%, a difference of 0.23%).
| Demographics | Rating | Rank | Unemployment Among Women with Children Under 18 years |
| Immigrants | Latvia | 70.8 /100 | #154 | Good 5.4% |
| Koreans | 70.5 /100 | #155 | Good 5.4% |
| South Africans | 70.3 /100 | #156 | Good 5.4% |
| German Russians | 70.2 /100 | #157 | Good 5.4% |
| Immigrants | Burma/Myanmar | 69.5 /100 | #158 | Good 5.4% |
| Chickasaw | 68.4 /100 | #159 | Good 5.4% |
| Afghans | 66.6 /100 | #160 | Good 5.4% |
| Immigrants | Iraq | 65.9 /100 | #161 | Good 5.4% |
| Immigrants | Saudi Arabia | 65.0 /100 | #162 | Good 5.4% |
| Lebanese | 64.7 /100 | #163 | Good 5.4% |
| Celtics | 63.0 /100 | #164 | Good 5.4% |
| Tlingit-Haida | 61.9 /100 | #165 | Good 5.4% |
| Aleuts | 59.4 /100 | #166 | Average 5.4% |
| Immigrants | Denmark | 58.0 /100 | #167 | Average 5.4% |
| Immigrants | Northern Africa | 56.1 /100 | #168 | Average 5.4% |
Demographics Similar to Chippewa by Unemployment Among Women with Children Under 18 years
In terms of unemployment among women with children under 18 years, the demographic groups most similar to Chippewa are Immigrants from Dominica (7.0%, a difference of 0.71%), Lumbee (7.1%, a difference of 0.86%), Paiute (6.9%, a difference of 1.9%), Pueblo (6.8%, a difference of 2.9%), and Houma (6.8%, a difference of 3.1%).
| Demographics | Rating | Rank | Unemployment Among Women with Children Under 18 years |
| Central American Indians | 0.0 /100 | #319 | Tragic 6.7% |
| Immigrants | Belize | 0.0 /100 | #320 | Tragic 6.7% |
| U.S. Virgin Islanders | 0.0 /100 | #321 | Tragic 6.7% |
| Houma | 0.0 /100 | #322 | Tragic 6.8% |
| Pueblo | 0.0 /100 | #323 | Tragic 6.8% |
| Paiute | 0.0 /100 | #324 | Tragic 6.9% |
| Immigrants | Dominica | 0.0 /100 | #325 | Tragic 7.0% |
| Chippewa | 0.0 /100 | #326 | Tragic 7.0% |
| Lumbee | 0.0 /100 | #327 | Tragic 7.1% |
| Natives/Alaskans | 0.0 /100 | #328 | Tragic 7.2% |
| Blacks/African Americans | 0.0 /100 | #329 | Tragic 7.3% |
| Colville | 0.0 /100 | #330 | Tragic 7.4% |
| Hopi | 0.0 /100 | #331 | Tragic 7.4% |
| Dominicans | 0.0 /100 | #332 | Tragic 7.5% |
| Immigrants | Dominican Republic | 0.0 /100 | #333 | Tragic 7.5% |