Immigrants from Iraq vs Immigrants from Peru Unemployment Among Women with Children Under 18 years
COMPARE
Immigrants from Iraq
Immigrants from Peru
Unemployment Among Women with Children Under 18 years
Unemployment Among Women with Children Under 18 years Comparison
Immigrants from Iraq
Immigrants from Peru
5.4%
UNEMPLOYMENT AMONG WOMEN WITH CHILDREN UNDER 18 YEARS
65.9/ 100
METRIC RATING
161st/ 347
METRIC RANK
5.7%
UNEMPLOYMENT AMONG WOMEN WITH CHILDREN UNDER 18 YEARS
7.4/ 100
METRIC RATING
216th/ 347
METRIC RANK
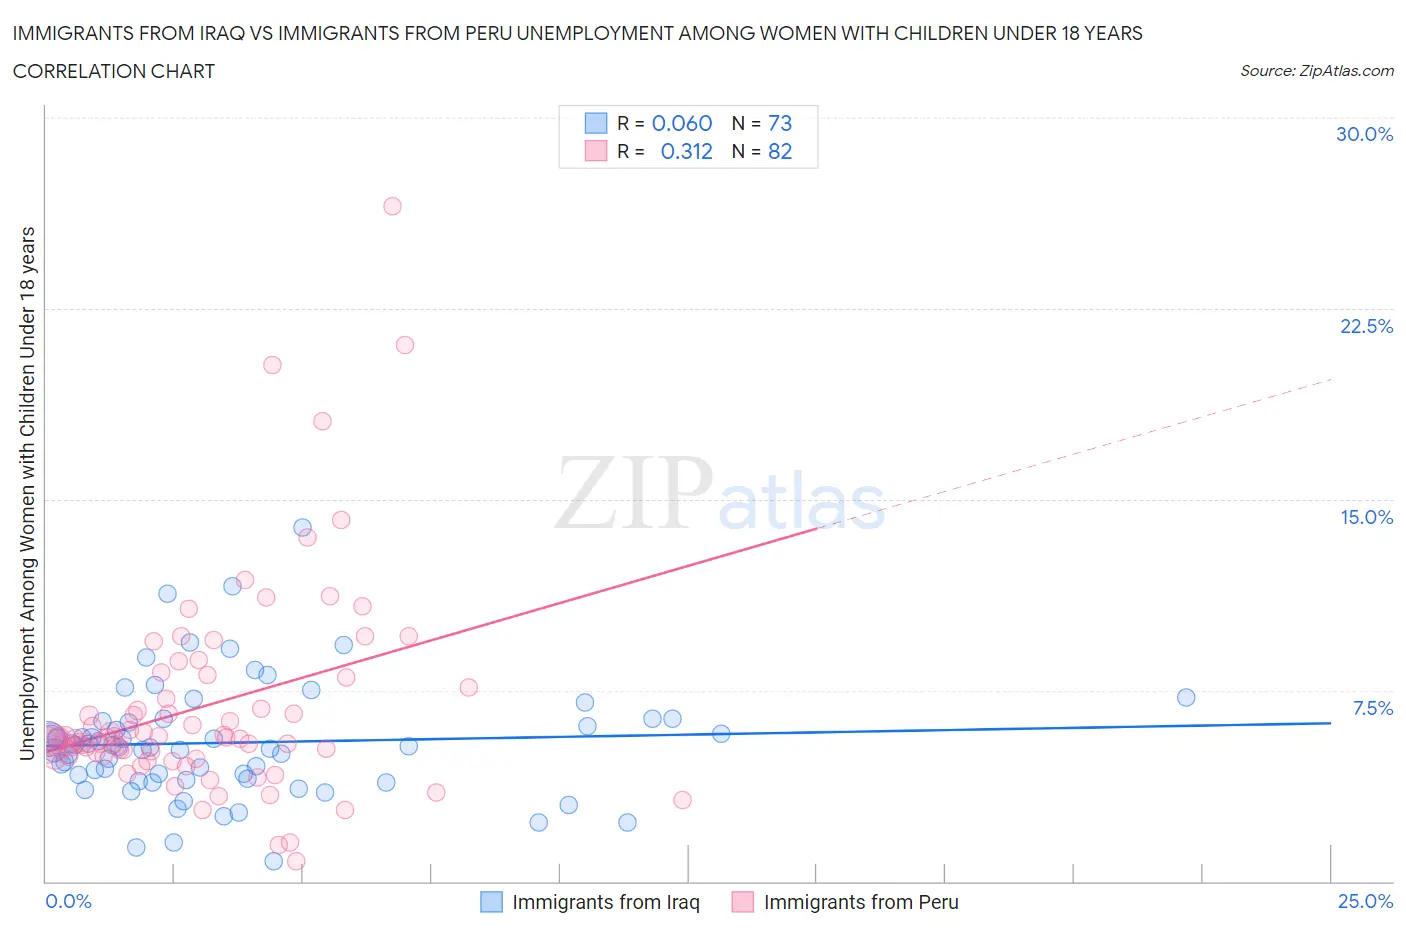
Immigrants from Iraq vs Immigrants from Peru Unemployment Among Women with Children Under 18 years Correlation Chart
The statistical analysis conducted on geographies consisting of 191,741,765 people shows a slight positive correlation between the proportion of Immigrants from Iraq and unemployment rate among women with children under the age of 18 in the United States with a correlation coefficient (R) of 0.060 and weighted average of 5.4%. Similarly, the statistical analysis conducted on geographies consisting of 320,260,784 people shows a mild positive correlation between the proportion of Immigrants from Peru and unemployment rate among women with children under the age of 18 in the United States with a correlation coefficient (R) of 0.312 and weighted average of 5.7%, a difference of 5.7%.
Unemployment Among Women with Children Under 18 years Correlation Summary
| Measurement | Immigrants from Iraq | Immigrants from Peru |
| Minimum | 0.80% | 0.80% |
| Maximum | 13.9% | 26.5% |
| Range | 13.1% | 25.7% |
| Mean | 5.4% | 6.9% |
| Median | 5.3% | 5.6% |
| Interquartile 25% (IQ1) | 4.0% | 4.9% |
| Interquartile 75% (IQ3) | 6.4% | 8.0% |
| Interquartile Range (IQR) | 2.3% | 3.1% |
| Standard Deviation (Sample) | 2.3% | 4.2% |
| Standard Deviation (Population) | 2.3% | 4.2% |
Similar Demographics by Unemployment Among Women with Children Under 18 years
Demographics Similar to Immigrants from Iraq by Unemployment Among Women with Children Under 18 years
In terms of unemployment among women with children under 18 years, the demographic groups most similar to Immigrants from Iraq are Afghan (5.4%, a difference of 0.050%), Immigrants from Saudi Arabia (5.4%, a difference of 0.070%), Lebanese (5.4%, a difference of 0.10%), Chickasaw (5.4%, a difference of 0.21%), and Celtic (5.4%, a difference of 0.23%).
| Demographics | Rating | Rank | Unemployment Among Women with Children Under 18 years |
| Immigrants | Latvia | 70.8 /100 | #154 | Good 5.4% |
| Koreans | 70.5 /100 | #155 | Good 5.4% |
| South Africans | 70.3 /100 | #156 | Good 5.4% |
| German Russians | 70.2 /100 | #157 | Good 5.4% |
| Immigrants | Burma/Myanmar | 69.5 /100 | #158 | Good 5.4% |
| Chickasaw | 68.4 /100 | #159 | Good 5.4% |
| Afghans | 66.6 /100 | #160 | Good 5.4% |
| Immigrants | Iraq | 65.9 /100 | #161 | Good 5.4% |
| Immigrants | Saudi Arabia | 65.0 /100 | #162 | Good 5.4% |
| Lebanese | 64.7 /100 | #163 | Good 5.4% |
| Celtics | 63.0 /100 | #164 | Good 5.4% |
| Tlingit-Haida | 61.9 /100 | #165 | Good 5.4% |
| Aleuts | 59.4 /100 | #166 | Average 5.4% |
| Immigrants | Denmark | 58.0 /100 | #167 | Average 5.4% |
| Immigrants | Northern Africa | 56.1 /100 | #168 | Average 5.4% |
Demographics Similar to Immigrants from Peru by Unemployment Among Women with Children Under 18 years
In terms of unemployment among women with children under 18 years, the demographic groups most similar to Immigrants from Peru are Immigrants from Brazil (5.7%, a difference of 0.090%), Immigrants from Uganda (5.7%, a difference of 0.10%), Immigrants from Nicaragua (5.7%, a difference of 0.12%), Iroquois (5.7%, a difference of 0.25%), and Japanese (5.7%, a difference of 0.30%).
| Demographics | Rating | Rank | Unemployment Among Women with Children Under 18 years |
| Immigrants | Western Asia | 11.3 /100 | #209 | Poor 5.6% |
| Immigrants | Nonimmigrants | 10.6 /100 | #210 | Poor 5.7% |
| Panamanians | 10.1 /100 | #211 | Poor 5.7% |
| South Americans | 10.0 /100 | #212 | Poor 5.7% |
| Americans | 8.9 /100 | #213 | Tragic 5.7% |
| Japanese | 8.7 /100 | #214 | Tragic 5.7% |
| Immigrants | Uganda | 7.9 /100 | #215 | Tragic 5.7% |
| Immigrants | Peru | 7.4 /100 | #216 | Tragic 5.7% |
| Immigrants | Brazil | 7.1 /100 | #217 | Tragic 5.7% |
| Immigrants | Nicaragua | 7.0 /100 | #218 | Tragic 5.7% |
| Iroquois | 6.5 /100 | #219 | Tragic 5.7% |
| Immigrants | Fiji | 6.3 /100 | #220 | Tragic 5.7% |
| Pennsylvania Germans | 5.7 /100 | #221 | Tragic 5.7% |
| Osage | 5.0 /100 | #222 | Tragic 5.7% |
| Potawatomi | 5.0 /100 | #223 | Tragic 5.7% |