Immigrants from Northern Europe vs Chippewa Unemployment Among Women with Children Under 18 years
COMPARE
Immigrants from Northern Europe
Chippewa
Unemployment Among Women with Children Under 18 years
Unemployment Among Women with Children Under 18 years Comparison
Immigrants from Northern Europe
Chippewa
5.1%
UNEMPLOYMENT AMONG WOMEN WITH CHILDREN UNDER 18 YEARS
95.9/ 100
METRIC RATING
74th/ 347
METRIC RANK
7.0%
UNEMPLOYMENT AMONG WOMEN WITH CHILDREN UNDER 18 YEARS
0.0/ 100
METRIC RATING
326th/ 347
METRIC RANK
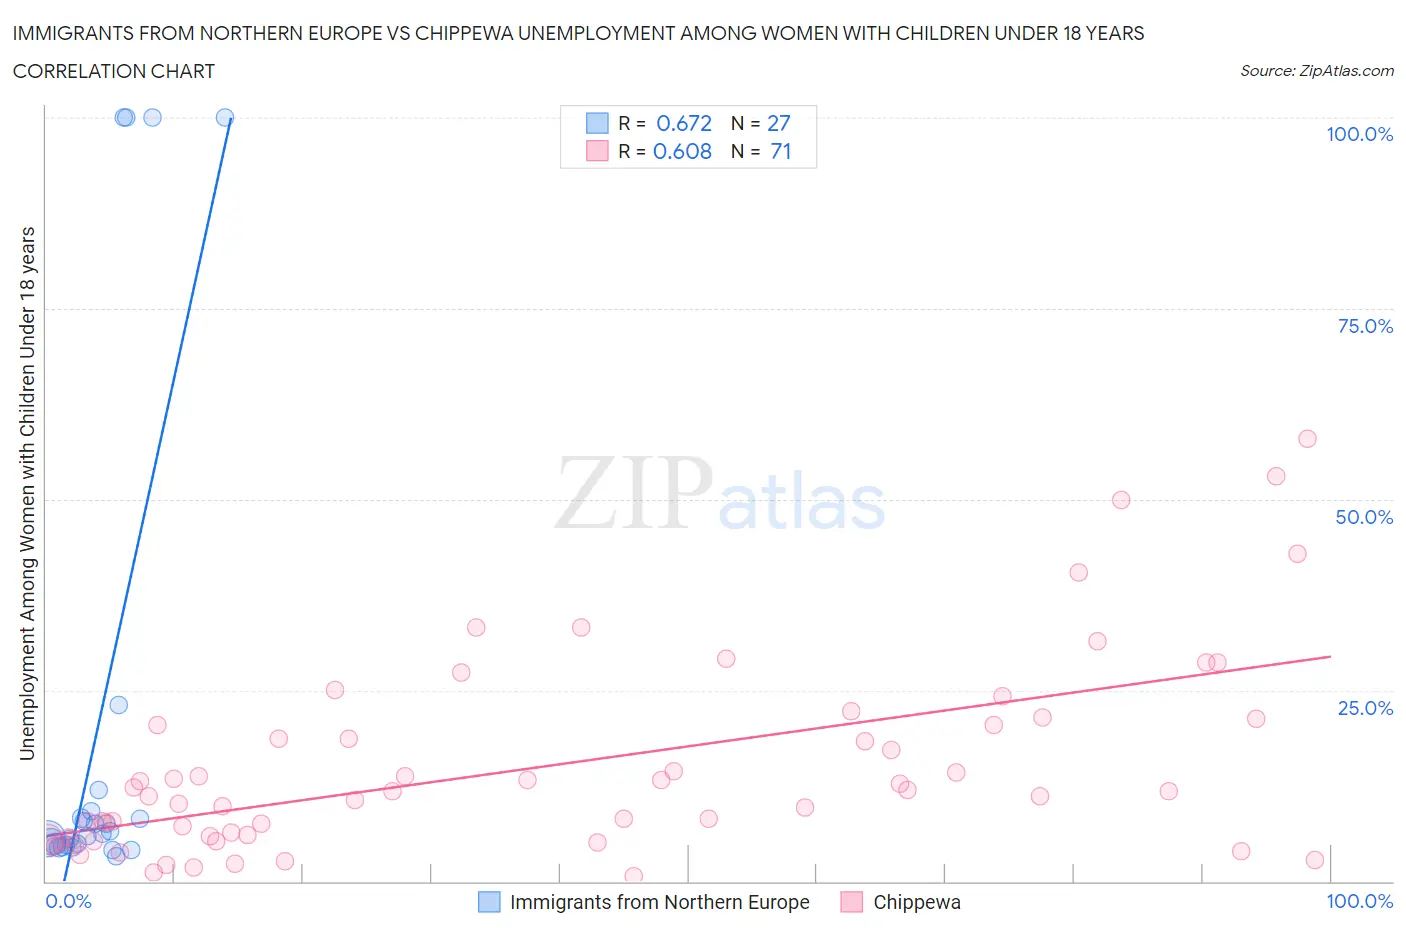
Immigrants from Northern Europe vs Chippewa Unemployment Among Women with Children Under 18 years Correlation Chart
The statistical analysis conducted on geographies consisting of 449,375,747 people shows a significant positive correlation between the proportion of Immigrants from Northern Europe and unemployment rate among women with children under the age of 18 in the United States with a correlation coefficient (R) of 0.672 and weighted average of 5.1%. Similarly, the statistical analysis conducted on geographies consisting of 207,005,580 people shows a significant positive correlation between the proportion of Chippewa and unemployment rate among women with children under the age of 18 in the United States with a correlation coefficient (R) of 0.608 and weighted average of 7.0%, a difference of 36.6%.
Unemployment Among Women with Children Under 18 years Correlation Summary
| Measurement | Immigrants from Northern Europe | Chippewa |
| Minimum | 3.3% | 0.70% |
| Maximum | 100.0% | 57.9% |
| Range | 96.7% | 57.2% |
| Mean | 20.7% | 15.0% |
| Median | 6.2% | 11.7% |
| Interquartile 25% (IQ1) | 4.8% | 5.7% |
| Interquartile 75% (IQ3) | 9.1% | 20.5% |
| Interquartile Range (IQR) | 4.3% | 14.7% |
| Standard Deviation (Sample) | 33.9% | 12.7% |
| Standard Deviation (Population) | 33.3% | 12.6% |
Similar Demographics by Unemployment Among Women with Children Under 18 years
Demographics Similar to Immigrants from Northern Europe by Unemployment Among Women with Children Under 18 years
In terms of unemployment among women with children under 18 years, the demographic groups most similar to Immigrants from Northern Europe are Albanian (5.1%, a difference of 0.010%), Immigrants from Asia (5.1%, a difference of 0.030%), Puget Sound Salish (5.1%, a difference of 0.060%), Immigrants from Bolivia (5.1%, a difference of 0.080%), and Zimbabwean (5.1%, a difference of 0.080%).
| Demographics | Rating | Rank | Unemployment Among Women with Children Under 18 years |
| Fijians | 96.9 /100 | #67 | Exceptional 5.1% |
| Irish | 96.8 /100 | #68 | Exceptional 5.1% |
| Austrians | 96.6 /100 | #69 | Exceptional 5.1% |
| Icelanders | 96.6 /100 | #70 | Exceptional 5.1% |
| Serbians | 96.5 /100 | #71 | Exceptional 5.1% |
| Immigrants | Bolivia | 96.1 /100 | #72 | Exceptional 5.1% |
| Albanians | 95.9 /100 | #73 | Exceptional 5.1% |
| Immigrants | Northern Europe | 95.9 /100 | #74 | Exceptional 5.1% |
| Immigrants | Asia | 95.8 /100 | #75 | Exceptional 5.1% |
| Puget Sound Salish | 95.8 /100 | #76 | Exceptional 5.1% |
| Zimbabweans | 95.7 /100 | #77 | Exceptional 5.1% |
| Assyrians/Chaldeans/Syriacs | 95.7 /100 | #78 | Exceptional 5.1% |
| Immigrants | Croatia | 95.6 /100 | #79 | Exceptional 5.1% |
| Bolivians | 95.5 /100 | #80 | Exceptional 5.1% |
| Immigrants | Lithuania | 95.4 /100 | #81 | Exceptional 5.2% |
Demographics Similar to Chippewa by Unemployment Among Women with Children Under 18 years
In terms of unemployment among women with children under 18 years, the demographic groups most similar to Chippewa are Immigrants from Dominica (7.0%, a difference of 0.71%), Lumbee (7.1%, a difference of 0.86%), Paiute (6.9%, a difference of 1.9%), Pueblo (6.8%, a difference of 2.9%), and Houma (6.8%, a difference of 3.1%).
| Demographics | Rating | Rank | Unemployment Among Women with Children Under 18 years |
| Central American Indians | 0.0 /100 | #319 | Tragic 6.7% |
| Immigrants | Belize | 0.0 /100 | #320 | Tragic 6.7% |
| U.S. Virgin Islanders | 0.0 /100 | #321 | Tragic 6.7% |
| Houma | 0.0 /100 | #322 | Tragic 6.8% |
| Pueblo | 0.0 /100 | #323 | Tragic 6.8% |
| Paiute | 0.0 /100 | #324 | Tragic 6.9% |
| Immigrants | Dominica | 0.0 /100 | #325 | Tragic 7.0% |
| Chippewa | 0.0 /100 | #326 | Tragic 7.0% |
| Lumbee | 0.0 /100 | #327 | Tragic 7.1% |
| Natives/Alaskans | 0.0 /100 | #328 | Tragic 7.2% |
| Blacks/African Americans | 0.0 /100 | #329 | Tragic 7.3% |
| Colville | 0.0 /100 | #330 | Tragic 7.4% |
| Hopi | 0.0 /100 | #331 | Tragic 7.4% |
| Dominicans | 0.0 /100 | #332 | Tragic 7.5% |
| Immigrants | Dominican Republic | 0.0 /100 | #333 | Tragic 7.5% |