Immigrants from Indonesia vs Spanish American Unemployment Among Ages 16 to 19 years
COMPARE
Immigrants from Indonesia
Spanish American
Unemployment Among Ages 16 to 19 years
Unemployment Among Ages 16 to 19 years Comparison
Immigrants from Indonesia
Spanish Americans
17.2%
UNEMPLOYMENT AMONG AGES 16 TO 19 YEARS
84.7/ 100
METRIC RATING
130th/ 347
METRIC RANK
18.2%
UNEMPLOYMENT AMONG AGES 16 TO 19 YEARS
4.7/ 100
METRIC RATING
230th/ 347
METRIC RANK
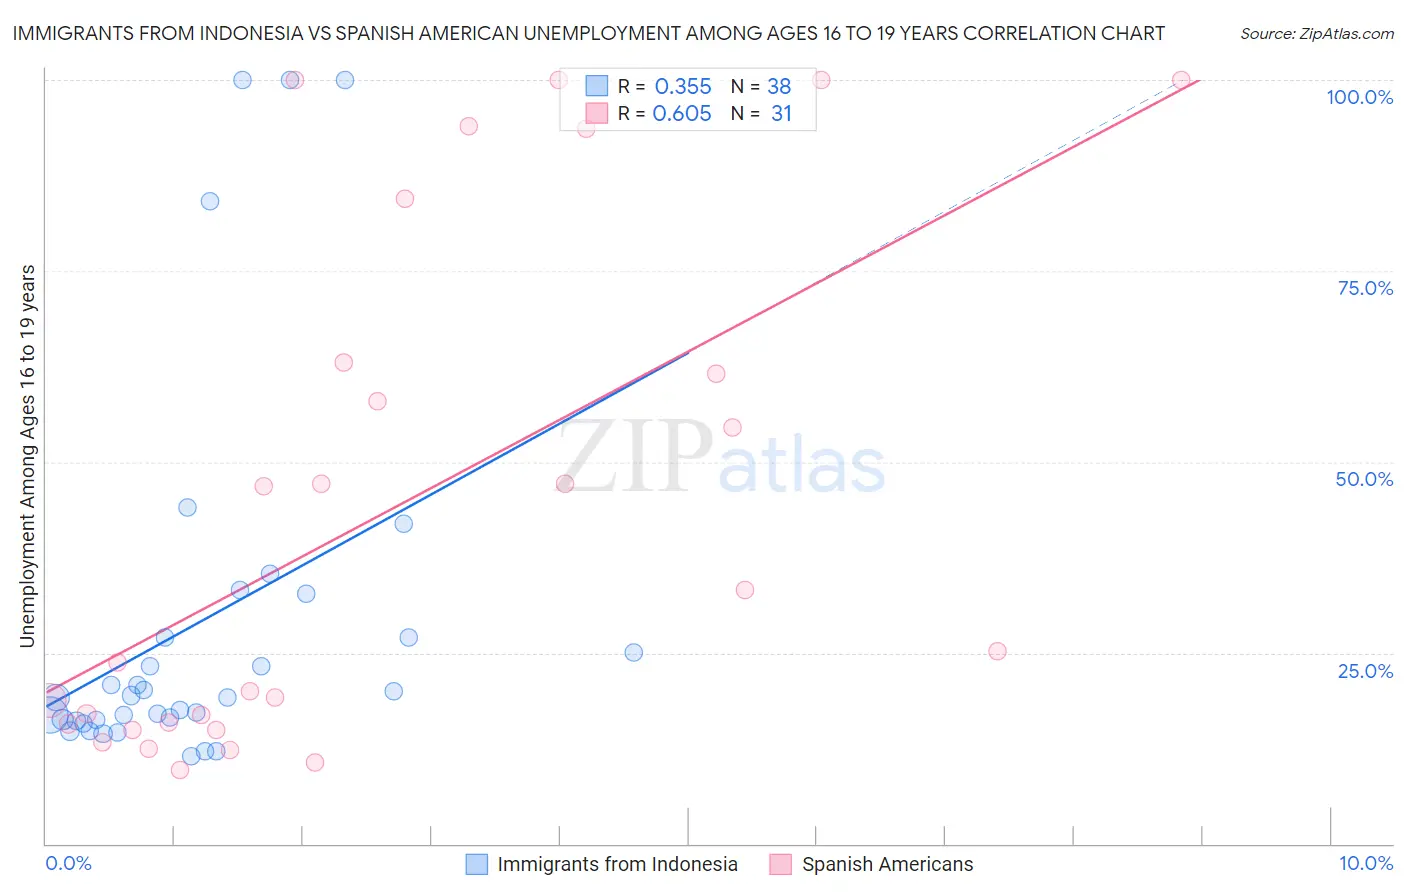
Immigrants from Indonesia vs Spanish American Unemployment Among Ages 16 to 19 years Correlation Chart
The statistical analysis conducted on geographies consisting of 210,010,963 people shows a mild positive correlation between the proportion of Immigrants from Indonesia and unemployment rate among population between the ages 16 and 19 in the United States with a correlation coefficient (R) of 0.355 and weighted average of 17.2%. Similarly, the statistical analysis conducted on geographies consisting of 101,797,625 people shows a significant positive correlation between the proportion of Spanish Americans and unemployment rate among population between the ages 16 and 19 in the United States with a correlation coefficient (R) of 0.605 and weighted average of 18.2%, a difference of 5.7%.
Unemployment Among Ages 16 to 19 years Correlation Summary
| Measurement | Immigrants from Indonesia | Spanish American |
| Minimum | 11.5% | 9.7% |
| Maximum | 100.0% | 100.0% |
| Range | 88.5% | 90.3% |
| Mean | 28.9% | 43.3% |
| Median | 19.3% | 25.2% |
| Interquartile 25% (IQ1) | 16.2% | 15.7% |
| Interquartile 75% (IQ3) | 27.0% | 62.9% |
| Interquartile Range (IQR) | 10.8% | 47.2% |
| Standard Deviation (Sample) | 24.7% | 33.1% |
| Standard Deviation (Population) | 24.3% | 32.5% |
Similar Demographics by Unemployment Among Ages 16 to 19 years
Demographics Similar to Immigrants from Indonesia by Unemployment Among Ages 16 to 19 years
In terms of unemployment among ages 16 to 19 years, the demographic groups most similar to Immigrants from Indonesia are German Russian (17.2%, a difference of 0.050%), Creek (17.2%, a difference of 0.070%), Arab (17.2%, a difference of 0.070%), Laotian (17.2%, a difference of 0.080%), and Potawatomi (17.2%, a difference of 0.080%).
| Demographics | Rating | Rank | Unemployment Among Ages 16 to 19 years |
| Immigrants | Laos | 88.8 /100 | #123 | Excellent 17.1% |
| Syrians | 88.6 /100 | #124 | Excellent 17.1% |
| Immigrants | Germany | 87.7 /100 | #125 | Excellent 17.2% |
| Immigrants | Bolivia | 86.7 /100 | #126 | Excellent 17.2% |
| Pakistanis | 85.8 /100 | #127 | Excellent 17.2% |
| Australians | 85.6 /100 | #128 | Excellent 17.2% |
| Creek | 85.5 /100 | #129 | Excellent 17.2% |
| Immigrants | Indonesia | 84.7 /100 | #130 | Excellent 17.2% |
| German Russians | 84.1 /100 | #131 | Excellent 17.2% |
| Arabs | 83.9 /100 | #132 | Excellent 17.2% |
| Laotians | 83.9 /100 | #133 | Excellent 17.2% |
| Potawatomi | 83.8 /100 | #134 | Excellent 17.2% |
| Samoans | 83.7 /100 | #135 | Excellent 17.2% |
| Immigrants | Oceania | 83.1 /100 | #136 | Excellent 17.2% |
| Immigrants | Malaysia | 82.8 /100 | #137 | Excellent 17.2% |
Demographics Similar to Spanish Americans by Unemployment Among Ages 16 to 19 years
In terms of unemployment among ages 16 to 19 years, the demographic groups most similar to Spanish Americans are Nepalese (18.2%, a difference of 0.14%), Immigrants from Russia (18.2%, a difference of 0.18%), Seminole (18.2%, a difference of 0.19%), Albanian (18.2%, a difference of 0.26%), and Colombian (18.3%, a difference of 0.29%).
| Demographics | Rating | Rank | Unemployment Among Ages 16 to 19 years |
| Immigrants | Western Asia | 10.2 /100 | #223 | Poor 18.0% |
| Immigrants | Serbia | 8.3 /100 | #224 | Tragic 18.1% |
| Immigrants | Chile | 7.5 /100 | #225 | Tragic 18.1% |
| Immigrants | Belgium | 7.3 /100 | #226 | Tragic 18.1% |
| Immigrants | Liberia | 7.1 /100 | #227 | Tragic 18.1% |
| Immigrants | Greece | 7.1 /100 | #228 | Tragic 18.1% |
| Albanians | 5.8 /100 | #229 | Tragic 18.2% |
| Spanish Americans | 4.7 /100 | #230 | Tragic 18.2% |
| Nepalese | 4.2 /100 | #231 | Tragic 18.2% |
| Immigrants | Russia | 4.0 /100 | #232 | Tragic 18.2% |
| Seminole | 4.0 /100 | #233 | Tragic 18.2% |
| Colombians | 3.7 /100 | #234 | Tragic 18.3% |
| French American Indians | 2.9 /100 | #235 | Tragic 18.3% |
| Immigrants | Colombia | 2.7 /100 | #236 | Tragic 18.3% |
| Immigrants | Immigrants | 2.7 /100 | #237 | Tragic 18.3% |