Immigrants from Indonesia vs Immigrants from Cuba Unemployment Among Ages 16 to 19 years
COMPARE
Immigrants from Indonesia
Immigrants from Cuba
Unemployment Among Ages 16 to 19 years
Unemployment Among Ages 16 to 19 years Comparison
Immigrants from Indonesia
Immigrants from Cuba
17.2%
UNEMPLOYMENT AMONG AGES 16 TO 19 YEARS
84.7/ 100
METRIC RATING
130th/ 347
METRIC RANK
16.6%
UNEMPLOYMENT AMONG AGES 16 TO 19 YEARS
99.2/ 100
METRIC RATING
61st/ 347
METRIC RANK
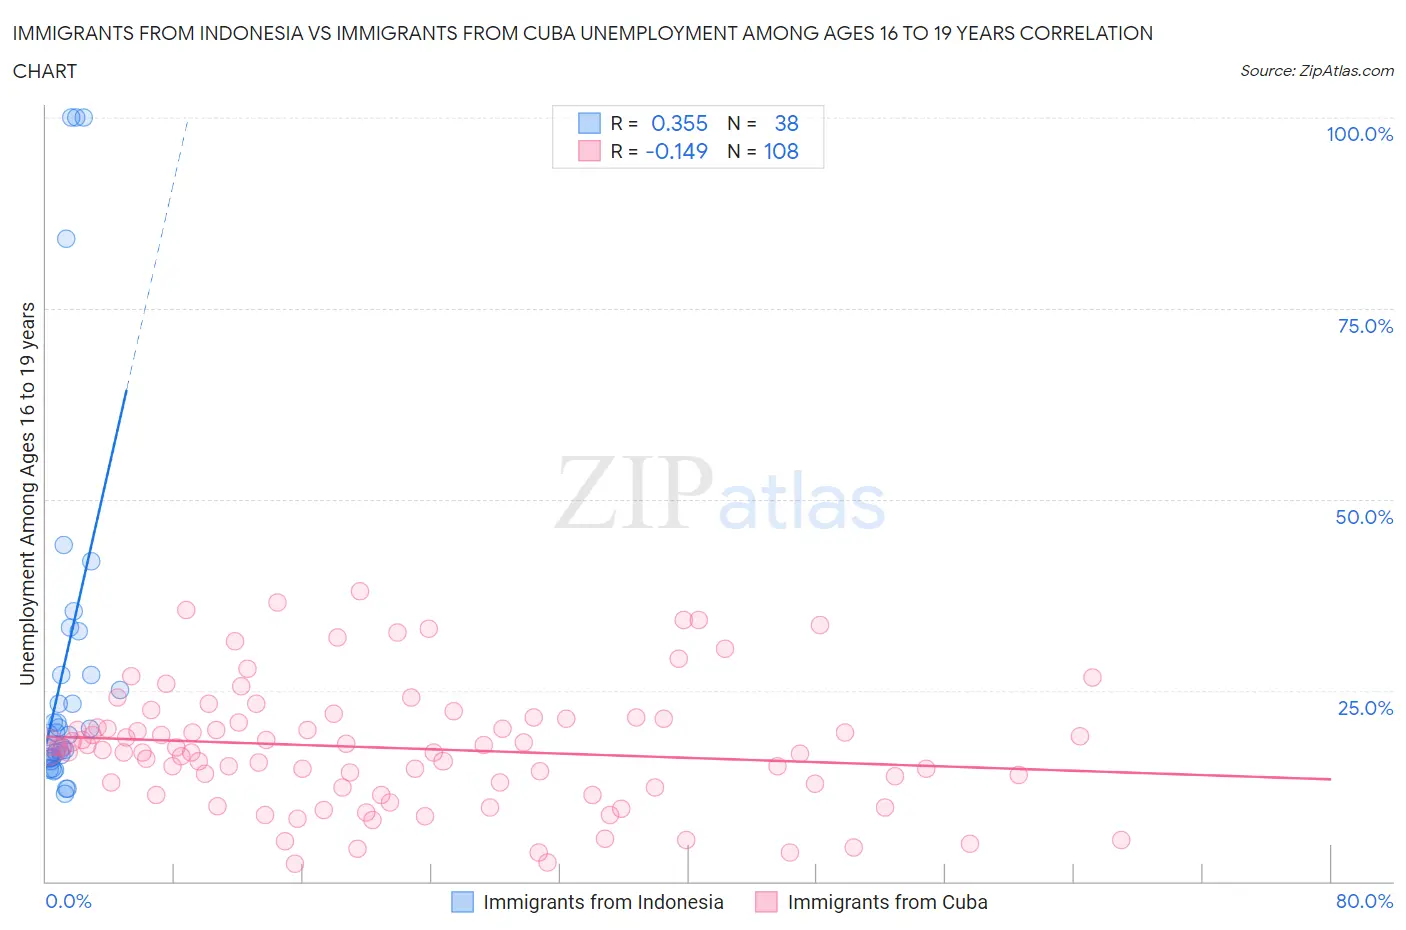
Immigrants from Indonesia vs Immigrants from Cuba Unemployment Among Ages 16 to 19 years Correlation Chart
The statistical analysis conducted on geographies consisting of 210,010,963 people shows a mild positive correlation between the proportion of Immigrants from Indonesia and unemployment rate among population between the ages 16 and 19 in the United States with a correlation coefficient (R) of 0.355 and weighted average of 17.2%. Similarly, the statistical analysis conducted on geographies consisting of 311,938,164 people shows a poor negative correlation between the proportion of Immigrants from Cuba and unemployment rate among population between the ages 16 and 19 in the United States with a correlation coefficient (R) of -0.149 and weighted average of 16.6%, a difference of 4.0%.
Unemployment Among Ages 16 to 19 years Correlation Summary
| Measurement | Immigrants from Indonesia | Immigrants from Cuba |
| Minimum | 11.5% | 2.3% |
| Maximum | 100.0% | 38.0% |
| Range | 88.5% | 35.7% |
| Mean | 28.9% | 17.4% |
| Median | 19.3% | 17.4% |
| Interquartile 25% (IQ1) | 16.2% | 12.3% |
| Interquartile 75% (IQ3) | 27.0% | 21.2% |
| Interquartile Range (IQR) | 10.8% | 9.0% |
| Standard Deviation (Sample) | 24.7% | 8.1% |
| Standard Deviation (Population) | 24.3% | 8.0% |
Similar Demographics by Unemployment Among Ages 16 to 19 years
Demographics Similar to Immigrants from Indonesia by Unemployment Among Ages 16 to 19 years
In terms of unemployment among ages 16 to 19 years, the demographic groups most similar to Immigrants from Indonesia are German Russian (17.2%, a difference of 0.050%), Creek (17.2%, a difference of 0.070%), Arab (17.2%, a difference of 0.070%), Laotian (17.2%, a difference of 0.080%), and Potawatomi (17.2%, a difference of 0.080%).
| Demographics | Rating | Rank | Unemployment Among Ages 16 to 19 years |
| Immigrants | Laos | 88.8 /100 | #123 | Excellent 17.1% |
| Syrians | 88.6 /100 | #124 | Excellent 17.1% |
| Immigrants | Germany | 87.7 /100 | #125 | Excellent 17.2% |
| Immigrants | Bolivia | 86.7 /100 | #126 | Excellent 17.2% |
| Pakistanis | 85.8 /100 | #127 | Excellent 17.2% |
| Australians | 85.6 /100 | #128 | Excellent 17.2% |
| Creek | 85.5 /100 | #129 | Excellent 17.2% |
| Immigrants | Indonesia | 84.7 /100 | #130 | Excellent 17.2% |
| German Russians | 84.1 /100 | #131 | Excellent 17.2% |
| Arabs | 83.9 /100 | #132 | Excellent 17.2% |
| Laotians | 83.9 /100 | #133 | Excellent 17.2% |
| Potawatomi | 83.8 /100 | #134 | Excellent 17.2% |
| Samoans | 83.7 /100 | #135 | Excellent 17.2% |
| Immigrants | Oceania | 83.1 /100 | #136 | Excellent 17.2% |
| Immigrants | Malaysia | 82.8 /100 | #137 | Excellent 17.2% |
Demographics Similar to Immigrants from Cuba by Unemployment Among Ages 16 to 19 years
In terms of unemployment among ages 16 to 19 years, the demographic groups most similar to Immigrants from Cuba are Menominee (16.6%, a difference of 0.060%), Macedonian (16.6%, a difference of 0.10%), Irish (16.5%, a difference of 0.23%), Immigrants from Uganda (16.5%, a difference of 0.28%), and Scotch-Irish (16.6%, a difference of 0.28%).
| Demographics | Rating | Rank | Unemployment Among Ages 16 to 19 years |
| British | 99.5 /100 | #54 | Exceptional 16.5% |
| Czechoslovakians | 99.5 /100 | #55 | Exceptional 16.5% |
| Sri Lankans | 99.5 /100 | #56 | Exceptional 16.5% |
| Immigrants | Jordan | 99.4 /100 | #57 | Exceptional 16.5% |
| Immigrants | Uganda | 99.4 /100 | #58 | Exceptional 16.5% |
| Irish | 99.4 /100 | #59 | Exceptional 16.5% |
| Menominee | 99.3 /100 | #60 | Exceptional 16.6% |
| Immigrants | Cuba | 99.2 /100 | #61 | Exceptional 16.6% |
| Macedonians | 99.2 /100 | #62 | Exceptional 16.6% |
| Scotch-Irish | 99.1 /100 | #63 | Exceptional 16.6% |
| Northern Europeans | 99.0 /100 | #64 | Exceptional 16.6% |
| Immigrants | Japan | 98.9 /100 | #65 | Exceptional 16.6% |
| Okinawans | 98.9 /100 | #66 | Exceptional 16.6% |
| Slavs | 98.7 /100 | #67 | Exceptional 16.7% |
| Chickasaw | 98.7 /100 | #68 | Exceptional 16.7% |