Immigrants from Bangladesh vs Spanish American Unemployment Among Ages 16 to 19 years

COMPARE

Immigrants from Bangladesh
Race
Ancestry
AfghanAfricanAlaska NativeAlaskan AthabascanAlbanianAleutAlsatianAmericanApacheArabArapahoArgentineanArmenianAssyrian/Chaldean/SyriacAustralianAustrianBahamianBangladeshiBarbadianBasqueBelgianBelizeanBermudanBhutaneseBlackfeetBolivianBrazilianBritishBritish West IndianBulgarianBurmeseCajunCambodianCanadianCape VerdeanCarpatho RusynCelticCentral AmericanCentral American IndianCherokeeCheyenneChickasawChileanChineseChippewaChoctawColombianColvilleComancheCosta RicanCreeCreekCroatianCrowCubanCypriotCzechCzechoslovakianDanishDelawareDominicanDutchDutch West IndianEastern EuropeanEcuadorianEgyptianEnglishEstonianEthiopianEuropeanFijianFilipinoFinnishFrenchFrench American IndianFrench CanadianGermanGerman RussianGhanaianGreekGuamanian/ChamorroGuatemalanGuyaneseHaitianHmongHonduranHopiHoumaHungarianIcelanderIndian (Asian)IndonesianInupiatIranianIraqiIrishIroquoisIsraeliItalianJamaicanJapaneseJordanianKenyanKiowaKoreanLaotianLatvianLebaneseLiberianLithuanianLumbeeLuxembourgerMacedonianMalaysianMalteseMarshalleseMenomineeMexicanMexican American IndianMongolianMoroccanNative HawaiianNavajoNepaleseNew ZealanderNicaraguanNigerianNorthern EuropeanNorwegianOkinawanOsageOttawaPaiutePakistaniPalestinianPanamanianParaguayanPennsylvania GermanPeruvianPimaPolishPortuguesePotawatomiPuebloPuerto RicanPuget Sound SalishRomanianRussianSalvadoranSamoanScandinavianScotch-IrishScottishSeminoleSenegaleseSerbianShoshoneSierra LeoneanSiouxSlavicSlovakSloveneSomaliSouth AfricanSouth AmericanSouth American IndianSoviet UnionSpaniardSpanishSpanish American IndianSri LankanSubsaharan AfricanSudaneseSwedishSwissSyrianTaiwaneseThaiTlingit-HaidaTohono O'OdhamTonganTrinidadian and TobagonianTsimshianTurkishU.S. Virgin IslanderUgandanUkrainianUruguayanUteVenezuelanVietnameseWelshWest IndianYakamaYaquiYugoslavianYumanYup'ikZimbabwean
Immigration
NonimmigrantsImmigrantsAfghanistanAfricaAlbaniaArgentinaArmeniaAsiaAustraliaAustriaBahamasBangladeshBarbadosBelarusBelgiumBelizeBoliviaBosnia and HerzegovinaBrazilBulgariaBurma/MyanmarCabo VerdeCambodiaCameroonCanadaCaribbeanCentral AmericaChileChinaColombiaCongoCosta RicaCroatiaCubaCzechoslovakiaDenmarkDominicaDominican RepublicEastern AfricaEastern AsiaEastern EuropeEcuadorEgyptEl SalvadorEnglandEritreaEthiopiaEuropeFijiFranceGermanyGhanaGreeceGrenadaGuatemalaGuyanaHaitiHondurasHong KongHungaryIndiaIndonesiaIranIraqIrelandIsraelItalyJamaicaJapanJordanKazakhstanKenyaKoreaKuwaitLaosLatin AmericaLatviaLebanonLiberiaLithuaniaMalaysiaMexicoMicronesiaMiddle AfricaMoldovaMoroccoNepalNetherlandsNicaraguaNigeriaNorth AmericaNorth MacedoniaNorthern AfricaNorthern EuropeNorwayOceaniaPakistanPanamaPeruPhilippinesPolandPortugalRomaniaRussiaSaudi ArabiaScotlandSenegalSerbiaSierra LeoneSingaporeSomaliaSouth AfricaSouth AmericaSouth Central AsiaSouth Eastern AsiaSouthern EuropeSpainSri LankaSt. Vincent and the GrenadinesSudanSwedenSwitzerlandSyriaTaiwanThailandTrinidad and TobagoTurkeyUgandaUkraineUruguayUzbekistanVenezuelaVietnamWest IndiesWestern AfricaWestern AsiaWestern EuropeYemenZaireZimbabweAzores
Spanish American
Race
Ancestry
AfghanAfricanAlaska NativeAlaskan AthabascanAlbanianAleutAlsatianAmericanApacheArabArapahoArgentineanArmenianAssyrian/Chaldean/SyriacAustralianAustrianBahamianBangladeshiBarbadianBasqueBelgianBelizeanBermudanBhutaneseBlackfeetBolivianBrazilianBritishBritish West IndianBulgarianBurmeseCajunCambodianCanadianCape VerdeanCarpatho RusynCelticCentral AmericanCentral American IndianCherokeeCheyenneChickasawChileanChineseChippewaChoctawColombianColvilleComancheCosta RicanCreeCreekCroatianCrowCubanCypriotCzechCzechoslovakianDanishDelawareDominicanDutchDutch West IndianEastern EuropeanEcuadorianEgyptianEnglishEstonianEthiopianEuropeanFijianFilipinoFinnishFrenchFrench American IndianFrench CanadianGermanGerman RussianGhanaianGreekGuamanian/ChamorroGuatemalanGuyaneseHaitianHmongHonduranHopiHoumaHungarianIcelanderIndian (Asian)IndonesianInupiatIranianIraqiIrishIroquoisIsraeliItalianJamaicanJapaneseJordanianKenyanKiowaKoreanLaotianLatvianLebaneseLiberianLithuanianLumbeeLuxembourgerMacedonianMalaysianMalteseMarshalleseMenomineeMexicanMexican American IndianMongolianMoroccanNative HawaiianNavajoNepaleseNew ZealanderNicaraguanNigerianNorthern EuropeanNorwegianOkinawanOsageOttawaPaiutePakistaniPalestinianPanamanianParaguayanPennsylvania GermanPeruvianPimaPolishPortuguesePotawatomiPuebloPuerto RicanPuget Sound SalishRomanianRussianSalvadoranSamoanScandinavianScotch-IrishScottishSeminoleSenegaleseSerbianShoshoneSierra LeoneanSiouxSlavicSlovakSloveneSomaliSouth AfricanSouth AmericanSouth American IndianSoviet UnionSpaniardSpanishSpanish AmericanSpanish American IndianSri LankanSubsaharan AfricanSudaneseSwedishSwissSyrianTaiwaneseThaiTlingit-HaidaTohono O'OdhamTonganTrinidadian and TobagonianTsimshianTurkishU.S. Virgin IslanderUgandanUkrainianUruguayanUteVenezuelanVietnameseWelshWest IndianYakamaYaquiYugoslavianYumanYup'ikZimbabwean
Immigration
NonimmigrantsImmigrantsAfghanistanAfricaAlbaniaArgentinaArmeniaAsiaAustraliaAustriaBahamasBarbadosBelarusBelgiumBelizeBoliviaBosnia and HerzegovinaBrazilBulgariaBurma/MyanmarCabo VerdeCambodiaCameroonCanadaCaribbeanCentral AmericaChileChinaColombiaCongoCosta RicaCroatiaCubaCzechoslovakiaDenmarkDominicaDominican RepublicEastern AfricaEastern AsiaEastern EuropeEcuadorEgyptEl SalvadorEnglandEritreaEthiopiaEuropeFijiFranceGermanyGhanaGreeceGrenadaGuatemalaGuyanaHaitiHondurasHong KongHungaryIndiaIndonesiaIranIraqIrelandIsraelItalyJamaicaJapanJordanKazakhstanKenyaKoreaKuwaitLaosLatin AmericaLatviaLebanonLiberiaLithuaniaMalaysiaMexicoMicronesiaMiddle AfricaMoldovaMoroccoNepalNetherlandsNicaraguaNigeriaNorth AmericaNorth MacedoniaNorthern AfricaNorthern EuropeNorwayOceaniaPakistanPanamaPeruPhilippinesPolandPortugalRomaniaRussiaSaudi ArabiaScotlandSenegalSerbiaSierra LeoneSingaporeSomaliaSouth AfricaSouth AmericaSouth Central AsiaSouth Eastern AsiaSouthern EuropeSpainSri LankaSt. Vincent and the GrenadinesSudanSwedenSwitzerlandSyriaTaiwanThailandTrinidad and TobagoTurkeyUgandaUkraineUruguayUzbekistanVenezuelaVietnamWest IndiesWestern AfricaWestern AsiaWestern EuropeYemenZaireZimbabweAzores
Unemployment Among Ages 16 to 19 years
Income
Poverty
Unemployment
Labor Participation
Family Structure
Vehicle Availability
Education Level
Disability

Unemployment Among Ages 16 to 19 years Comparison

Immigrants from Bangladesh

Spanish Americans

Tragic
Tragic
21.5%
UNEMPLOYMENT AMONG AGES 16 TO 19 YEARS
0.0/ 100
METRIC RATING
308th/ 347
METRIC RANK
18.2%
UNEMPLOYMENT AMONG AGES 16 TO 19 YEARS
4.7/ 100
METRIC RATING
230th/ 347
METRIC RANK

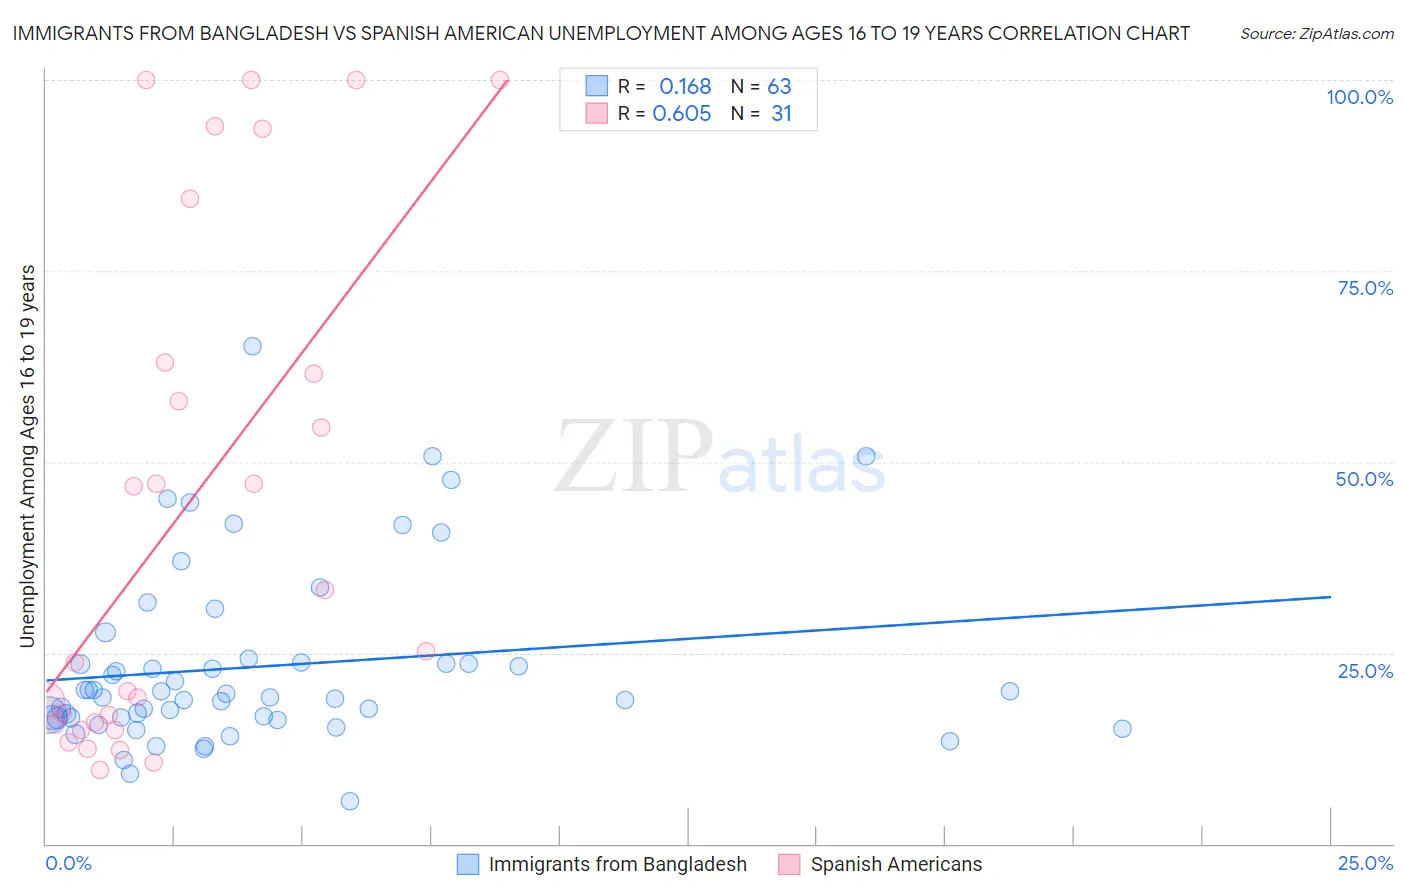
Immigrants from Bangladesh vs Spanish American Unemployment Among Ages 16 to 19 years Correlation Chart

The statistical analysis conducted on geographies consisting of 198,385,806 people shows a poor positive correlation between the proportion of Immigrants from Bangladesh and unemployment rate among population between the ages 16 and 19 in the United States with a correlation coefficient (R) of 0.168 and weighted average of 21.5%. Similarly, the statistical analysis conducted on geographies consisting of 101,797,625 people shows a significant positive correlation between the proportion of Spanish Americans and unemployment rate among population between the ages 16 and 19 in the United States with a correlation coefficient (R) of 0.605 and weighted average of 18.2%, a difference of 18.0%.
Immigrants from Bangladesh vs Spanish American Unemployment Among Ages 16 to 19 years

Unemployment Among Ages 16 to 19 years Correlation Summary

MeasurementImmigrants from BangladeshSpanish American
Minimum5.5%9.7%
Maximum65.1%100.0%
Range59.6%90.3%
Mean23.2%43.3%
Median19.2%25.2%
Interquartile 25% (IQ1)16.5%15.7%
Interquartile 75% (IQ3)23.8%62.9%
Interquartile Range (IQR)7.3%47.2%
Standard Deviation (Sample)11.7%33.1%
Standard Deviation (Population)11.6%32.5%

Similar Demographics by Unemployment Among Ages 16 to 19 years

Demographics Similar to Immigrants from Bangladesh by Unemployment Among Ages 16 to 19 years

In terms of unemployment among ages 16 to 19 years, the demographic groups most similar to Immigrants from Bangladesh are Native/Alaskan (21.5%, a difference of 0.16%), Vietnamese (21.5%, a difference of 0.22%), Black/African American (21.4%, a difference of 0.38%), Belizean (21.6%, a difference of 0.44%), and Houma (21.6%, a difference of 0.70%).
DemographicsRating | RankUnemployment Among Ages 16 to 19 years
Immigrants | Ecuador
0.0
/100
|
#301
Tragic
20.9%
Immigrants | Caribbean
0.0
/100
|
#302
Tragic
20.9%
Senegalese
0.0
/100
|
#303
Tragic
21.0%
Aleuts
0.0
/100
|
#304
Tragic
21.2%
Immigrants | Senegal
0.0
/100
|
#305
Tragic
21.2%
U.S. Virgin Islanders
0.0
/100
|
#306
Tragic
21.3%
Blacks/African Americans
0.0
/100
|
#307
Tragic
21.4%
Immigrants | Bangladesh
0.0
/100
|
#308
Tragic
21.5%
Natives/Alaskans
0.0
/100
|
#309
Tragic
21.5%
Vietnamese
0.0
/100
|
#310
Tragic
21.5%
Belizeans
0.0
/100
|
#311
Tragic
21.6%
Houma
0.0
/100
|
#312
Tragic
21.6%
Jamaicans
0.0
/100
|
#313
Tragic
21.7%
Alaska Natives
0.0
/100
|
#314
Tragic
21.8%
Immigrants | Dominica
0.0
/100
|
#315
Tragic
21.9%

Demographics Similar to Spanish Americans by Unemployment Among Ages 16 to 19 years

In terms of unemployment among ages 16 to 19 years, the demographic groups most similar to Spanish Americans are Nepalese (18.2%, a difference of 0.14%), Immigrants from Russia (18.2%, a difference of 0.18%), Seminole (18.2%, a difference of 0.19%), Albanian (18.2%, a difference of 0.26%), and Colombian (18.3%, a difference of 0.29%).
DemographicsRating | RankUnemployment Among Ages 16 to 19 years
Immigrants | Western Asia
10.2
/100
|
#223
Poor
18.0%
Immigrants | Serbia
8.3
/100
|
#224
Tragic
18.1%
Immigrants | Chile
7.5
/100
|
#225
Tragic
18.1%
Immigrants | Belgium
7.3
/100
|
#226
Tragic
18.1%
Immigrants | Liberia
7.1
/100
|
#227
Tragic
18.1%
Immigrants | Greece
7.1
/100
|
#228
Tragic
18.1%
Albanians
5.8
/100
|
#229
Tragic
18.2%
Spanish Americans
4.7
/100
|
#230
Tragic
18.2%
Nepalese
4.2
/100
|
#231
Tragic
18.2%
Immigrants | Russia
4.0
/100
|
#232
Tragic
18.2%
Seminole
4.0
/100
|
#233
Tragic
18.2%
Colombians
3.7
/100
|
#234
Tragic
18.3%
French American Indians
2.9
/100
|
#235
Tragic
18.3%
Immigrants | Colombia
2.7
/100
|
#236
Tragic
18.3%
Immigrants | Immigrants
2.7
/100
|
#237
Tragic
18.3%