Immigrants from Hungary vs Trinidadian and Tobagonian Unemployment Among Ages 25 to 29 years
COMPARE
Immigrants from Hungary
Trinidadian and Tobagonian
Unemployment Among Ages 25 to 29 years
Unemployment Among Ages 25 to 29 years Comparison
Immigrants from Hungary
Trinidadians and Tobagonians
6.4%
UNEMPLOYMENT AMONG AGES 25 TO 29 YEARS
89.4/ 100
METRIC RATING
106th/ 347
METRIC RANK
7.8%
UNEMPLOYMENT AMONG AGES 25 TO 29 YEARS
0.0/ 100
METRIC RATING
294th/ 347
METRIC RANK
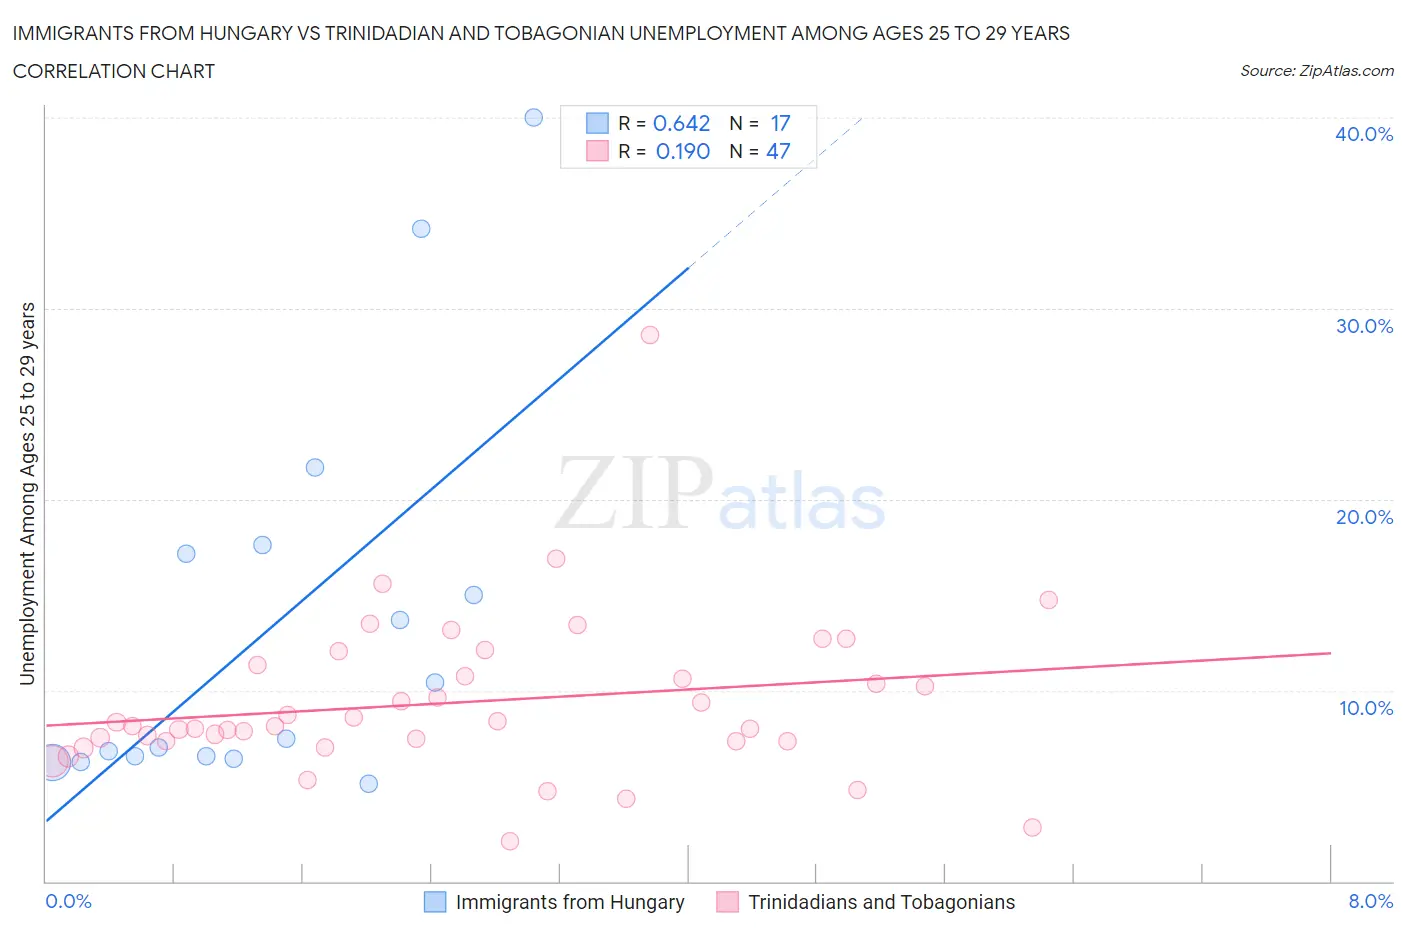
Immigrants from Hungary vs Trinidadian and Tobagonian Unemployment Among Ages 25 to 29 years Correlation Chart
The statistical analysis conducted on geographies consisting of 189,998,532 people shows a significant positive correlation between the proportion of Immigrants from Hungary and unemployment rate among population between the ages 25 and 29 in the United States with a correlation coefficient (R) of 0.642 and weighted average of 6.4%. Similarly, the statistical analysis conducted on geographies consisting of 214,424,084 people shows a poor positive correlation between the proportion of Trinidadians and Tobagonians and unemployment rate among population between the ages 25 and 29 in the United States with a correlation coefficient (R) of 0.190 and weighted average of 7.8%, a difference of 21.1%.
Unemployment Among Ages 25 to 29 years Correlation Summary
| Measurement | Immigrants from Hungary | Trinidadian and Tobagonian |
| Minimum | 5.1% | 2.1% |
| Maximum | 40.0% | 28.6% |
| Range | 34.9% | 26.5% |
| Mean | 13.4% | 9.4% |
| Median | 7.5% | 8.1% |
| Interquartile 25% (IQ1) | 6.5% | 7.3% |
| Interquartile 75% (IQ3) | 17.4% | 11.3% |
| Interquartile Range (IQR) | 10.9% | 4.0% |
| Standard Deviation (Sample) | 10.3% | 4.3% |
| Standard Deviation (Population) | 10.0% | 4.2% |
Similar Demographics by Unemployment Among Ages 25 to 29 years
Demographics Similar to Immigrants from Hungary by Unemployment Among Ages 25 to 29 years
In terms of unemployment among ages 25 to 29 years, the demographic groups most similar to Immigrants from Hungary are Immigrants from Kazakhstan (6.4%, a difference of 0.070%), Cypriot (6.4%, a difference of 0.11%), Swiss (6.4%, a difference of 0.14%), Immigrants from Congo (6.4%, a difference of 0.17%), and British (6.4%, a difference of 0.19%).
| Demographics | Rating | Rank | Unemployment Among Ages 25 to 29 years |
| Iraqis | 91.3 /100 | #99 | Exceptional 6.4% |
| Uruguayans | 91.2 /100 | #100 | Exceptional 6.4% |
| Immigrants | Ireland | 91.1 /100 | #101 | Exceptional 6.4% |
| British | 90.5 /100 | #102 | Exceptional 6.4% |
| Immigrants | Congo | 90.4 /100 | #103 | Exceptional 6.4% |
| Cypriots | 90.1 /100 | #104 | Exceptional 6.4% |
| Immigrants | Kazakhstan | 89.8 /100 | #105 | Excellent 6.4% |
| Immigrants | Hungary | 89.4 /100 | #106 | Excellent 6.4% |
| Swiss | 88.6 /100 | #107 | Excellent 6.4% |
| Croatians | 88.2 /100 | #108 | Excellent 6.4% |
| Immigrants | Albania | 87.9 /100 | #109 | Excellent 6.4% |
| Europeans | 87.8 /100 | #110 | Excellent 6.4% |
| Immigrants | Colombia | 87.6 /100 | #111 | Excellent 6.4% |
| Immigrants | Nicaragua | 87.5 /100 | #112 | Excellent 6.4% |
| Immigrants | Egypt | 87.1 /100 | #113 | Excellent 6.5% |
Demographics Similar to Trinidadians and Tobagonians by Unemployment Among Ages 25 to 29 years
In terms of unemployment among ages 25 to 29 years, the demographic groups most similar to Trinidadians and Tobagonians are Immigrants from Belize (7.8%, a difference of 0.28%), Chippewa (7.8%, a difference of 0.33%), Comanche (7.8%, a difference of 0.46%), Immigrants from West Indies (7.8%, a difference of 0.59%), and Hispanic or Latino (7.7%, a difference of 0.74%).
| Demographics | Rating | Rank | Unemployment Among Ages 25 to 29 years |
| Immigrants | Mexico | 0.0 /100 | #287 | Tragic 7.6% |
| Africans | 0.0 /100 | #288 | Tragic 7.6% |
| Belizeans | 0.0 /100 | #289 | Tragic 7.7% |
| Armenians | 0.0 /100 | #290 | Tragic 7.7% |
| Hispanics or Latinos | 0.0 /100 | #291 | Tragic 7.7% |
| Chippewa | 0.0 /100 | #292 | Tragic 7.8% |
| Immigrants | Belize | 0.0 /100 | #293 | Tragic 7.8% |
| Trinidadians and Tobagonians | 0.0 /100 | #294 | Tragic 7.8% |
| Comanche | 0.0 /100 | #295 | Tragic 7.8% |
| Immigrants | West Indies | 0.0 /100 | #296 | Tragic 7.8% |
| Blackfeet | 0.0 /100 | #297 | Tragic 7.9% |
| Immigrants | Trinidad and Tobago | 0.0 /100 | #298 | Tragic 7.9% |
| Barbadians | 0.0 /100 | #299 | Tragic 7.9% |
| Central American Indians | 0.0 /100 | #300 | Tragic 7.9% |
| West Indians | 0.0 /100 | #301 | Tragic 7.9% |