Immigrants from Sudan vs Trinidadian and Tobagonian Unemployment Among Ages 25 to 29 years
COMPARE
Immigrants from Sudan
Trinidadian and Tobagonian
Unemployment Among Ages 25 to 29 years
Unemployment Among Ages 25 to 29 years Comparison
Immigrants from Sudan
Trinidadians and Tobagonians
5.8%
UNEMPLOYMENT AMONG AGES 25 TO 29 YEARS
100.0/ 100
METRIC RATING
10th/ 347
METRIC RANK
7.8%
UNEMPLOYMENT AMONG AGES 25 TO 29 YEARS
0.0/ 100
METRIC RATING
294th/ 347
METRIC RANK
Immigrants from Sudan vs Trinidadian and Tobagonian Unemployment Among Ages 25 to 29 years Correlation Chart
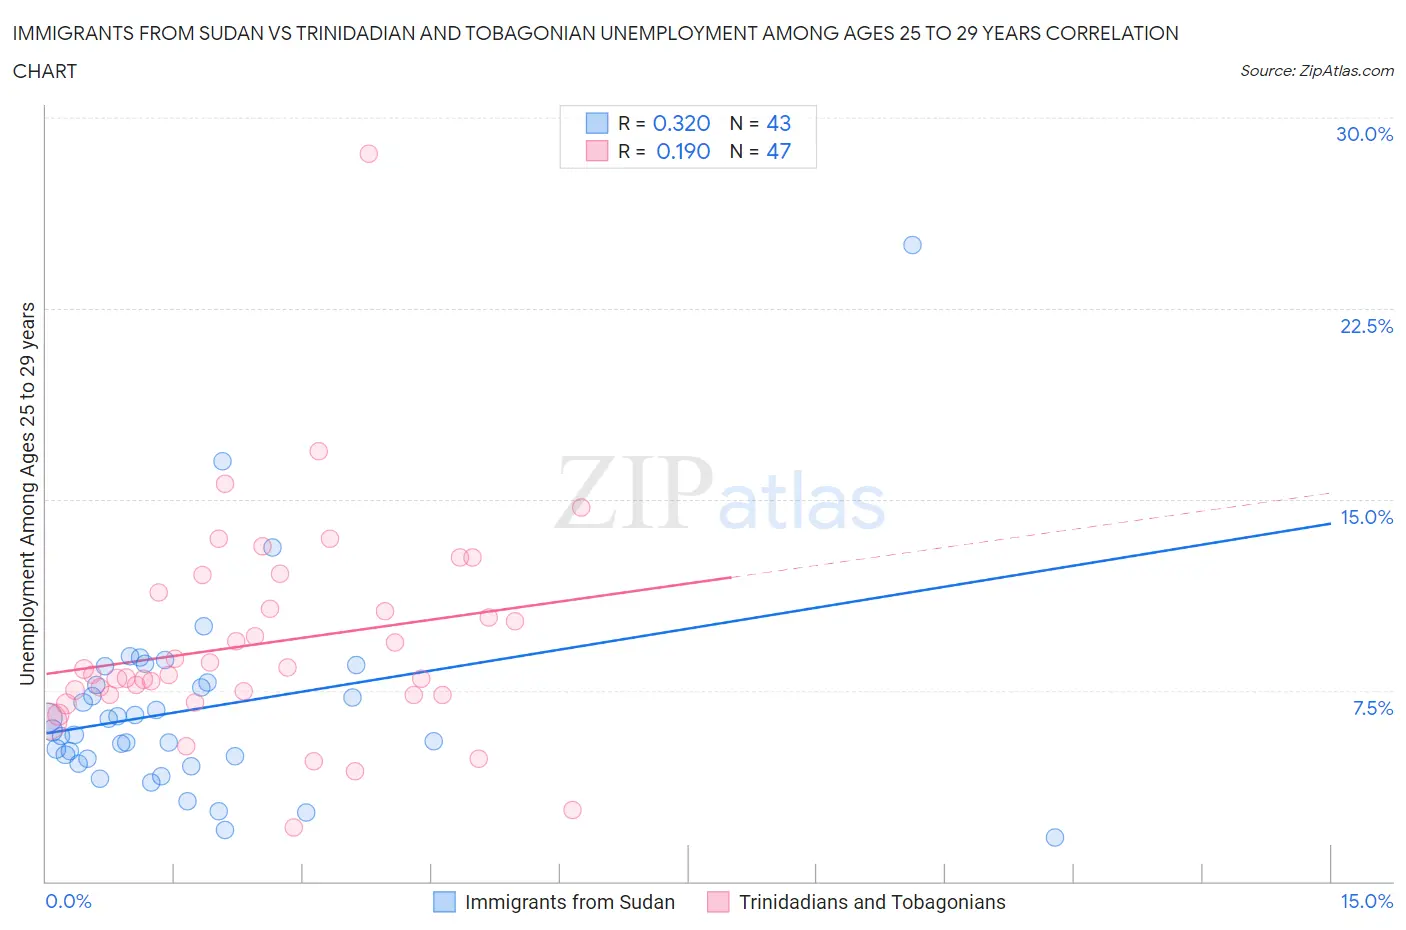
The statistical analysis conducted on geographies consisting of 117,455,527 people shows a mild positive correlation between the proportion of Immigrants from Sudan and unemployment rate among population between the ages 25 and 29 in the United States with a correlation coefficient (R) of 0.320 and weighted average of 5.8%. Similarly, the statistical analysis conducted on geographies consisting of 214,424,084 people shows a poor positive correlation between the proportion of Trinidadians and Tobagonians and unemployment rate among population between the ages 25 and 29 in the United States with a correlation coefficient (R) of 0.190 and weighted average of 7.8%, a difference of 34.6%.
Unemployment Among Ages 25 to 29 years Correlation Summary
| Measurement | Immigrants from Sudan | Trinidadian and Tobagonian |
| Minimum | 1.7% | 2.1% |
| Maximum | 25.0% | 28.6% |
| Range | 23.3% | 26.5% |
| Mean | 6.8% | 9.4% |
| Median | 5.9% | 8.1% |
| Interquartile 25% (IQ1) | 4.8% | 7.3% |
| Interquartile 75% (IQ3) | 7.8% | 11.3% |
| Interquartile Range (IQR) | 3.0% | 4.0% |
| Standard Deviation (Sample) | 3.9% | 4.3% |
| Standard Deviation (Population) | 3.9% | 4.2% |
Similar Demographics by Unemployment Among Ages 25 to 29 years
Demographics Similar to Immigrants from Sudan by Unemployment Among Ages 25 to 29 years
In terms of unemployment among ages 25 to 29 years, the demographic groups most similar to Immigrants from Sudan are Immigrants from Nepal (5.7%, a difference of 0.67%), Cambodian (5.8%, a difference of 1.1%), Okinawan (5.9%, a difference of 1.2%), Immigrants from Bolivia (5.9%, a difference of 1.2%), and Immigrants from Kuwait (5.9%, a difference of 1.8%).
| Demographics | Rating | Rank | Unemployment Among Ages 25 to 29 years |
| Immigrants | Somalia | 100.0 /100 | #3 | Exceptional 5.5% |
| Immigrants | Cuba | 100.0 /100 | #4 | Exceptional 5.6% |
| Somalis | 100.0 /100 | #5 | Exceptional 5.6% |
| Hmong | 100.0 /100 | #6 | Exceptional 5.7% |
| Immigrants | India | 100.0 /100 | #7 | Exceptional 5.7% |
| Immigrants | Bosnia and Herzegovina | 100.0 /100 | #8 | Exceptional 5.7% |
| Immigrants | Nepal | 100.0 /100 | #9 | Exceptional 5.7% |
| Immigrants | Sudan | 100.0 /100 | #10 | Exceptional 5.8% |
| Cambodians | 100.0 /100 | #11 | Exceptional 5.8% |
| Okinawans | 100.0 /100 | #12 | Exceptional 5.9% |
| Immigrants | Bolivia | 100.0 /100 | #13 | Exceptional 5.9% |
| Immigrants | Kuwait | 99.9 /100 | #14 | Exceptional 5.9% |
| Cubans | 99.9 /100 | #15 | Exceptional 5.9% |
| Immigrants | Bulgaria | 99.9 /100 | #16 | Exceptional 5.9% |
| Bolivians | 99.9 /100 | #17 | Exceptional 5.9% |
Demographics Similar to Trinidadians and Tobagonians by Unemployment Among Ages 25 to 29 years
In terms of unemployment among ages 25 to 29 years, the demographic groups most similar to Trinidadians and Tobagonians are Immigrants from Belize (7.8%, a difference of 0.28%), Chippewa (7.8%, a difference of 0.33%), Comanche (7.8%, a difference of 0.46%), Immigrants from West Indies (7.8%, a difference of 0.59%), and Hispanic or Latino (7.7%, a difference of 0.74%).
| Demographics | Rating | Rank | Unemployment Among Ages 25 to 29 years |
| Immigrants | Mexico | 0.0 /100 | #287 | Tragic 7.6% |
| Africans | 0.0 /100 | #288 | Tragic 7.6% |
| Belizeans | 0.0 /100 | #289 | Tragic 7.7% |
| Armenians | 0.0 /100 | #290 | Tragic 7.7% |
| Hispanics or Latinos | 0.0 /100 | #291 | Tragic 7.7% |
| Chippewa | 0.0 /100 | #292 | Tragic 7.8% |
| Immigrants | Belize | 0.0 /100 | #293 | Tragic 7.8% |
| Trinidadians and Tobagonians | 0.0 /100 | #294 | Tragic 7.8% |
| Comanche | 0.0 /100 | #295 | Tragic 7.8% |
| Immigrants | West Indies | 0.0 /100 | #296 | Tragic 7.8% |
| Blackfeet | 0.0 /100 | #297 | Tragic 7.9% |
| Immigrants | Trinidad and Tobago | 0.0 /100 | #298 | Tragic 7.9% |
| Barbadians | 0.0 /100 | #299 | Tragic 7.9% |
| Central American Indians | 0.0 /100 | #300 | Tragic 7.9% |
| West Indians | 0.0 /100 | #301 | Tragic 7.9% |