Immigrants from Hungary vs Alaska Native Unemployment Among Ages 25 to 29 years

COMPARE

Immigrants from Hungary
Race
Ancestry
AfghanAfricanAlaskan AthabascanAlbanianAleutAlsatianAmericanApacheArabArapahoArgentineanArmenianAssyrian/Chaldean/SyriacAustralianAustrianBahamianBangladeshiBarbadianBasqueBelgianBelizeanBermudanBhutaneseBlackfeetBolivianBrazilianBritishBritish West IndianBulgarianBurmeseCajunCambodianCanadianCape VerdeanCarpatho RusynCelticCentral AmericanCentral American IndianCherokeeCheyenneChickasawChileanChineseChippewaChoctawColombianColvilleComancheCosta RicanCreeCreekCroatianCrowCubanCypriotCzechCzechoslovakianDanishDelawareDominicanDutchDutch West IndianEastern EuropeanEcuadorianEgyptianEnglishEstonianEthiopianEuropeanFijianFilipinoFinnishFrenchFrench American IndianFrench CanadianGermanGerman RussianGhanaianGreekGuamanian/ChamorroGuatemalanGuyaneseHaitianHmongHonduranHopiHoumaHungarianIcelanderIndian (Asian)IndonesianInupiatIranianIraqiIrishIroquoisIsraeliItalianJamaicanJapaneseJordanianKenyanKiowaKoreanLaotianLatvianLebaneseLiberianLithuanianLumbeeLuxembourgerMacedonianMalaysianMalteseMarshalleseMenomineeMexicanMexican American IndianMongolianMoroccanNative HawaiianNavajoNepaleseNew ZealanderNicaraguanNigerianNorthern EuropeanNorwegianOkinawanOsageOttawaPaiutePakistaniPalestinianPanamanianParaguayanPennsylvania GermanPeruvianPimaPolishPortuguesePotawatomiPuebloPuerto RicanPuget Sound SalishRomanianRussianSalvadoranSamoanScandinavianScotch-IrishScottishSeminoleSenegaleseSerbianShoshoneSierra LeoneanSiouxSlavicSlovakSloveneSomaliSouth AfricanSouth AmericanSouth American IndianSoviet UnionSpaniardSpanishSpanish AmericanSpanish American IndianSri LankanSubsaharan AfricanSudaneseSwedishSwissSyrianTaiwaneseThaiTlingit-HaidaTohono O'OdhamTonganTrinidadian and TobagonianTsimshianTurkishU.S. Virgin IslanderUgandanUkrainianUruguayanUteVenezuelanVietnameseWelshWest IndianYakamaYaquiYugoslavianYumanYup'ikZimbabwean
Immigration
NonimmigrantsImmigrantsAfghanistanAfricaAlbaniaArgentinaArmeniaAsiaAustraliaAustriaBahamasBangladeshBarbadosBelarusBelgiumBelizeBoliviaBosnia and HerzegovinaBrazilBulgariaBurma/MyanmarCabo VerdeCambodiaCameroonCanadaCaribbeanCentral AmericaChileChinaColombiaCongoCosta RicaCroatiaCubaCzechoslovakiaDenmarkDominicaDominican RepublicEastern AfricaEastern AsiaEastern EuropeEcuadorEgyptEl SalvadorEnglandEritreaEthiopiaEuropeFijiFranceGermanyGhanaGreeceGrenadaGuatemalaGuyanaHaitiHondurasHong KongHungaryIndiaIndonesiaIranIraqIrelandIsraelItalyJamaicaJapanJordanKazakhstanKenyaKoreaKuwaitLaosLatin AmericaLatviaLebanonLiberiaLithuaniaMalaysiaMexicoMicronesiaMiddle AfricaMoldovaMoroccoNepalNetherlandsNicaraguaNigeriaNorth AmericaNorth MacedoniaNorthern AfricaNorthern EuropeNorwayOceaniaPakistanPanamaPeruPhilippinesPolandPortugalRomaniaRussiaSaudi ArabiaScotlandSenegalSerbiaSierra LeoneSingaporeSomaliaSouth AfricaSouth AmericaSouth Central AsiaSouth Eastern AsiaSouthern EuropeSpainSri LankaSt. Vincent and the GrenadinesSudanSwedenSwitzerlandSyriaTaiwanThailandTrinidad and TobagoTurkeyUgandaUkraineUruguayUzbekistanVenezuelaVietnamWest IndiesWestern AfricaWestern AsiaWestern EuropeYemenZaireZimbabweAzores
Alaska Native
Race
Ancestry
AfghanAfricanAlaska NativeAlaskan AthabascanAlbanianAleutAlsatianAmericanApacheArabArapahoArgentineanArmenianAssyrian/Chaldean/SyriacAustralianAustrianBahamianBangladeshiBarbadianBasqueBelgianBelizeanBermudanBhutaneseBlackfeetBolivianBrazilianBritishBritish West IndianBulgarianBurmeseCajunCambodianCanadianCape VerdeanCarpatho RusynCelticCentral AmericanCentral American IndianCherokeeCheyenneChickasawChileanChineseChippewaChoctawColombianColvilleComancheCosta RicanCreeCreekCroatianCrowCubanCypriotCzechCzechoslovakianDanishDelawareDominicanDutchDutch West IndianEastern EuropeanEcuadorianEgyptianEnglishEstonianEthiopianEuropeanFijianFilipinoFinnishFrenchFrench American IndianFrench CanadianGermanGerman RussianGhanaianGreekGuamanian/ChamorroGuatemalanGuyaneseHaitianHmongHonduranHopiHoumaHungarianIcelanderIndian (Asian)IndonesianInupiatIranianIraqiIrishIroquoisIsraeliItalianJamaicanJapaneseJordanianKenyanKiowaKoreanLaotianLatvianLebaneseLiberianLithuanianLumbeeLuxembourgerMacedonianMalaysianMalteseMarshalleseMenomineeMexicanMexican American IndianMongolianMoroccanNative HawaiianNavajoNepaleseNew ZealanderNicaraguanNigerianNorthern EuropeanNorwegianOkinawanOsageOttawaPaiutePakistaniPalestinianPanamanianParaguayanPennsylvania GermanPeruvianPimaPolishPortuguesePotawatomiPuebloPuerto RicanPuget Sound SalishRomanianRussianSalvadoranSamoanScandinavianScotch-IrishScottishSeminoleSenegaleseSerbianShoshoneSierra LeoneanSiouxSlavicSlovakSloveneSomaliSouth AfricanSouth AmericanSouth American IndianSoviet UnionSpaniardSpanishSpanish AmericanSpanish American IndianSri LankanSubsaharan AfricanSudaneseSwedishSwissSyrianTaiwaneseThaiTlingit-HaidaTohono O'OdhamTonganTrinidadian and TobagonianTsimshianTurkishU.S. Virgin IslanderUgandanUkrainianUruguayanUteVenezuelanVietnameseWelshWest IndianYakamaYaquiYugoslavianYumanYup'ikZimbabwean
Immigration
NonimmigrantsImmigrantsAfghanistanAfricaAlbaniaArgentinaArmeniaAsiaAustraliaAustriaBahamasBangladeshBarbadosBelarusBelgiumBelizeBoliviaBosnia and HerzegovinaBrazilBulgariaBurma/MyanmarCabo VerdeCambodiaCameroonCanadaCaribbeanCentral AmericaChileChinaColombiaCongoCosta RicaCroatiaCubaCzechoslovakiaDenmarkDominicaDominican RepublicEastern AfricaEastern AsiaEastern EuropeEcuadorEgyptEl SalvadorEnglandEritreaEthiopiaEuropeFijiFranceGermanyGhanaGreeceGrenadaGuatemalaGuyanaHaitiHondurasHong KongIndiaIndonesiaIranIraqIrelandIsraelItalyJamaicaJapanJordanKazakhstanKenyaKoreaKuwaitLaosLatin AmericaLatviaLebanonLiberiaLithuaniaMalaysiaMexicoMicronesiaMiddle AfricaMoldovaMoroccoNepalNetherlandsNicaraguaNigeriaNorth AmericaNorth MacedoniaNorthern AfricaNorthern EuropeNorwayOceaniaPakistanPanamaPeruPhilippinesPolandPortugalRomaniaRussiaSaudi ArabiaScotlandSenegalSerbiaSierra LeoneSingaporeSomaliaSouth AfricaSouth AmericaSouth Central AsiaSouth Eastern AsiaSouthern EuropeSpainSri LankaSt. Vincent and the GrenadinesSudanSwedenSwitzerlandSyriaTaiwanThailandTrinidad and TobagoTurkeyUgandaUkraineUruguayUzbekistanVenezuelaVietnamWest IndiesWestern AfricaWestern AsiaWestern EuropeYemenZaireZimbabweAzores
Unemployment Among Ages 25 to 29 years
Income
Poverty
Unemployment
Labor Participation
Family Structure
Vehicle Availability
Education Level
Disability

Unemployment Among Ages 25 to 29 years Comparison

Immigrants from Hungary

Alaska Natives

Excellent
Tragic
6.4%
UNEMPLOYMENT AMONG AGES 25 TO 29 YEARS
89.4/ 100
METRIC RATING
106th/ 347
METRIC RANK
10.2%
UNEMPLOYMENT AMONG AGES 25 TO 29 YEARS
0.0/ 100
METRIC RATING
331st/ 347
METRIC RANK

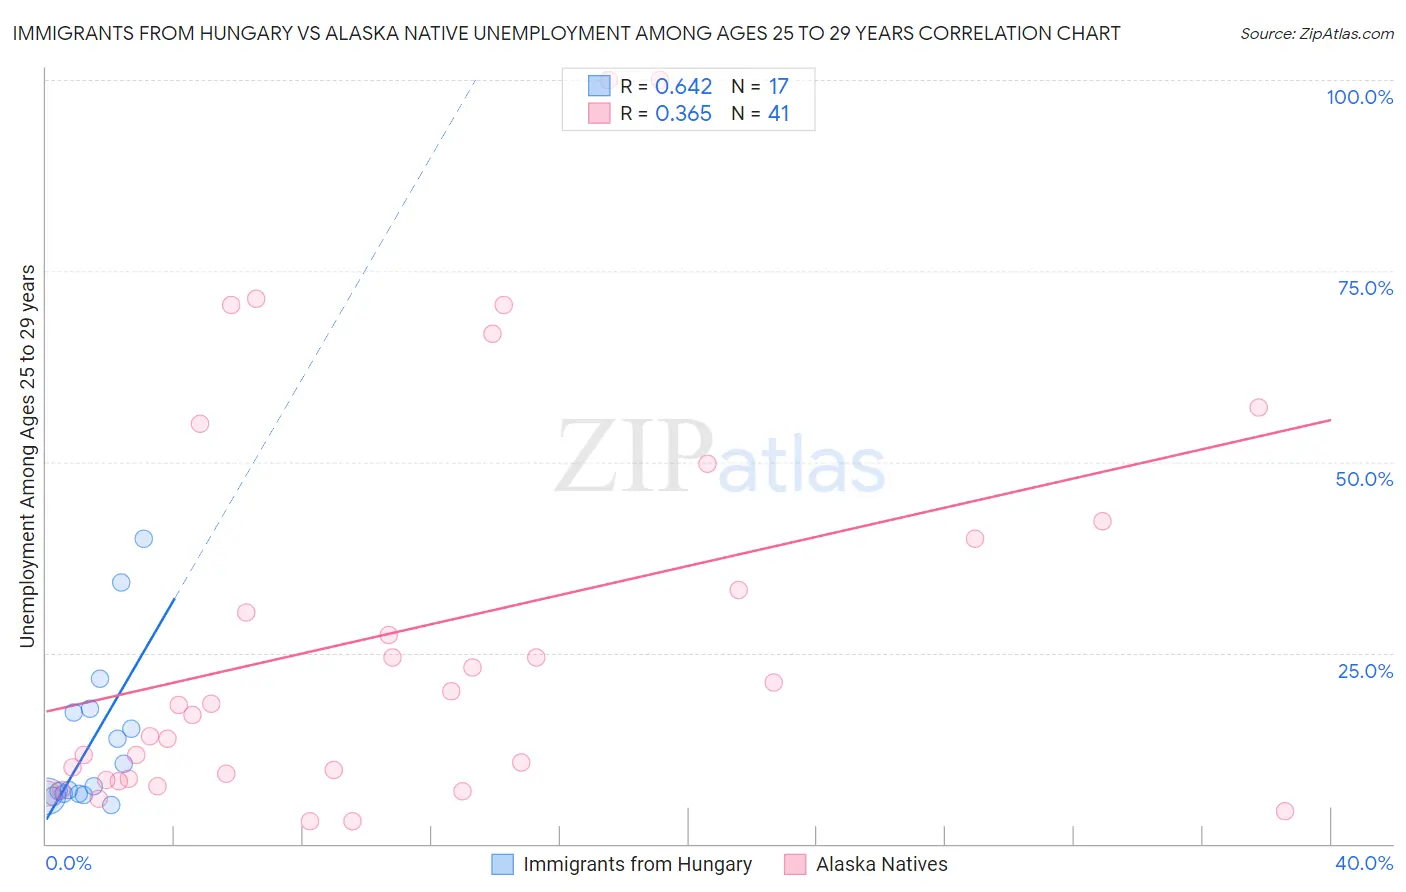
Immigrants from Hungary vs Alaska Native Unemployment Among Ages 25 to 29 years Correlation Chart

The statistical analysis conducted on geographies consisting of 189,998,532 people shows a significant positive correlation between the proportion of Immigrants from Hungary and unemployment rate among population between the ages 25 and 29 in the United States with a correlation coefficient (R) of 0.642 and weighted average of 6.4%. Similarly, the statistical analysis conducted on geographies consisting of 75,796,081 people shows a mild positive correlation between the proportion of Alaska Natives and unemployment rate among population between the ages 25 and 29 in the United States with a correlation coefficient (R) of 0.365 and weighted average of 10.2%, a difference of 58.6%.
Immigrants from Hungary vs Alaska Native Unemployment Among Ages 25 to 29 years

Unemployment Among Ages 25 to 29 years Correlation Summary

MeasurementImmigrants from HungaryAlaska Native
Minimum5.1%2.9%
Maximum40.0%100.0%
Range34.9%97.1%
Mean13.4%27.8%
Median7.5%18.1%
Interquartile 25% (IQ1)6.5%8.4%
Interquartile 75% (IQ3)17.4%41.1%
Interquartile Range (IQR)10.9%32.7%
Standard Deviation (Sample)10.3%26.4%
Standard Deviation (Population)10.0%26.0%

Similar Demographics by Unemployment Among Ages 25 to 29 years

Demographics Similar to Immigrants from Hungary by Unemployment Among Ages 25 to 29 years

In terms of unemployment among ages 25 to 29 years, the demographic groups most similar to Immigrants from Hungary are Immigrants from Kazakhstan (6.4%, a difference of 0.070%), Cypriot (6.4%, a difference of 0.11%), Swiss (6.4%, a difference of 0.14%), Immigrants from Congo (6.4%, a difference of 0.17%), and British (6.4%, a difference of 0.19%).
DemographicsRating | RankUnemployment Among Ages 25 to 29 years
Iraqis
91.3
/100
|
#99
Exceptional
6.4%
Uruguayans
91.2
/100
|
#100
Exceptional
6.4%
Immigrants | Ireland
91.1
/100
|
#101
Exceptional
6.4%
British
90.5
/100
|
#102
Exceptional
6.4%
Immigrants | Congo
90.4
/100
|
#103
Exceptional
6.4%
Cypriots
90.1
/100
|
#104
Exceptional
6.4%
Immigrants | Kazakhstan
89.8
/100
|
#105
Excellent
6.4%
Immigrants | Hungary
89.4
/100
|
#106
Excellent
6.4%
Swiss
88.6
/100
|
#107
Excellent
6.4%
Croatians
88.2
/100
|
#108
Excellent
6.4%
Immigrants | Albania
87.9
/100
|
#109
Excellent
6.4%
Europeans
87.8
/100
|
#110
Excellent
6.4%
Immigrants | Colombia
87.6
/100
|
#111
Excellent
6.4%
Immigrants | Nicaragua
87.5
/100
|
#112
Excellent
6.4%
Immigrants | Egypt
87.1
/100
|
#113
Excellent
6.5%

Demographics Similar to Alaska Natives by Unemployment Among Ages 25 to 29 years

In terms of unemployment among ages 25 to 29 years, the demographic groups most similar to Alaska Natives are Pueblo (10.4%, a difference of 2.3%), Native/Alaskan (9.8%, a difference of 3.7%), Aleut (9.7%, a difference of 5.2%), Alaskan Athabascan (10.8%, a difference of 5.8%), and Apache (9.5%, a difference of 7.5%).
DemographicsRating | RankUnemployment Among Ages 25 to 29 years
Houma
0.0
/100
|
#324
Tragic
8.7%
Yakama
0.0
/100
|
#325
Tragic
8.8%
Shoshone
0.0
/100
|
#326
Tragic
9.2%
Colville
0.0
/100
|
#327
Tragic
9.2%
Apache
0.0
/100
|
#328
Tragic
9.5%
Aleuts
0.0
/100
|
#329
Tragic
9.7%
Natives/Alaskans
0.0
/100
|
#330
Tragic
9.8%
Alaska Natives
0.0
/100
|
#331
Tragic
10.2%
Pueblo
0.0
/100
|
#332
Tragic
10.4%
Alaskan Athabascans
0.0
/100
|
#333
Tragic
10.8%
Yuman
0.0
/100
|
#334
Tragic
11.0%
Puerto Ricans
0.0
/100
|
#335
Tragic
11.1%
Lumbee
0.0
/100
|
#336
Tragic
11.2%
Menominee
0.0
/100
|
#337
Tragic
11.3%
Sioux
0.0
/100
|
#338
Tragic
11.7%