Hungarian vs Alaska Native Unemployment Among Ages 25 to 29 years
COMPARE
Hungarian
Alaska Native
Unemployment Among Ages 25 to 29 years
Unemployment Among Ages 25 to 29 years Comparison
Hungarians
Alaska Natives
6.8%
UNEMPLOYMENT AMONG AGES 25 TO 29 YEARS
26.8/ 100
METRIC RATING
196th/ 347
METRIC RANK
10.2%
UNEMPLOYMENT AMONG AGES 25 TO 29 YEARS
0.0/ 100
METRIC RATING
331st/ 347
METRIC RANK
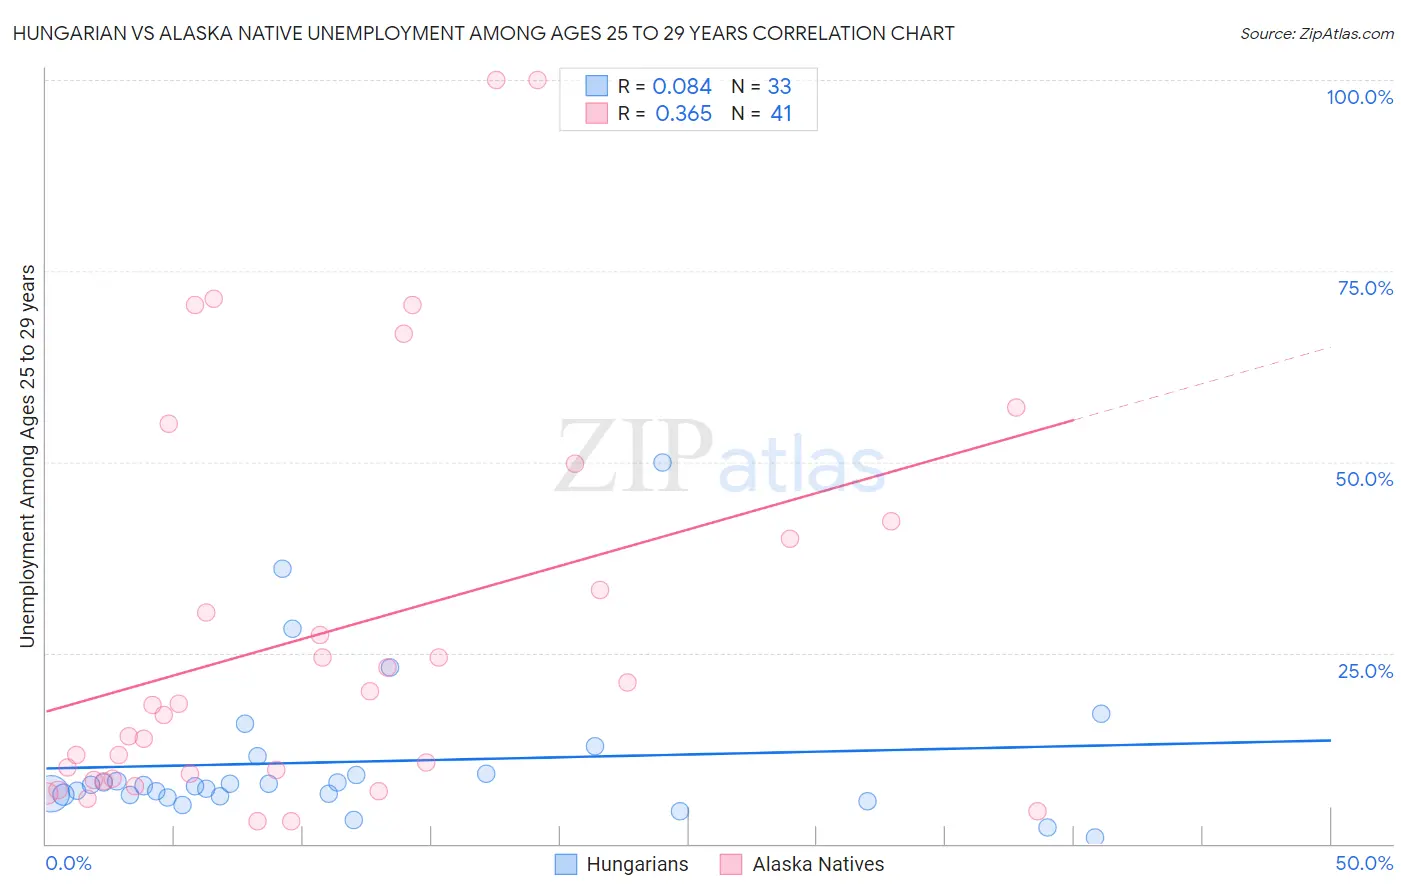
Hungarian vs Alaska Native Unemployment Among Ages 25 to 29 years Correlation Chart
The statistical analysis conducted on geographies consisting of 447,409,304 people shows a slight positive correlation between the proportion of Hungarians and unemployment rate among population between the ages 25 and 29 in the United States with a correlation coefficient (R) of 0.084 and weighted average of 6.8%. Similarly, the statistical analysis conducted on geographies consisting of 75,796,081 people shows a mild positive correlation between the proportion of Alaska Natives and unemployment rate among population between the ages 25 and 29 in the United States with a correlation coefficient (R) of 0.365 and weighted average of 10.2%, a difference of 51.0%.
Unemployment Among Ages 25 to 29 years Correlation Summary
| Measurement | Hungarian | Alaska Native |
| Minimum | 0.80% | 2.9% |
| Maximum | 50.0% | 100.0% |
| Range | 49.2% | 97.1% |
| Mean | 10.8% | 27.8% |
| Median | 7.6% | 18.1% |
| Interquartile 25% (IQ1) | 6.3% | 8.4% |
| Interquartile 75% (IQ3) | 10.3% | 41.1% |
| Interquartile Range (IQR) | 4.0% | 32.7% |
| Standard Deviation (Sample) | 10.1% | 26.4% |
| Standard Deviation (Population) | 10.0% | 26.0% |
Similar Demographics by Unemployment Among Ages 25 to 29 years
Demographics Similar to Hungarians by Unemployment Among Ages 25 to 29 years
In terms of unemployment among ages 25 to 29 years, the demographic groups most similar to Hungarians are Italian (6.8%, a difference of 0.020%), Immigrants from Western Asia (6.7%, a difference of 0.040%), Alsatian (6.7%, a difference of 0.10%), Immigrants from Greece (6.7%, a difference of 0.10%), and Immigrants from Ukraine (6.7%, a difference of 0.14%).
| Demographics | Rating | Rank | Unemployment Among Ages 25 to 29 years |
| Argentineans | 32.1 /100 | #189 | Fair 6.7% |
| Koreans | 29.3 /100 | #190 | Fair 6.7% |
| Chickasaw | 28.7 /100 | #191 | Fair 6.7% |
| Immigrants | Ukraine | 28.6 /100 | #192 | Fair 6.7% |
| Alsatians | 28.1 /100 | #193 | Fair 6.7% |
| Immigrants | Greece | 28.0 /100 | #194 | Fair 6.7% |
| Immigrants | Western Asia | 27.3 /100 | #195 | Fair 6.7% |
| Hungarians | 26.8 /100 | #196 | Fair 6.8% |
| Italians | 26.5 /100 | #197 | Fair 6.8% |
| Immigrants | Southern Europe | 24.6 /100 | #198 | Fair 6.8% |
| Guamanians/Chamorros | 24.3 /100 | #199 | Fair 6.8% |
| South American Indians | 23.3 /100 | #200 | Fair 6.8% |
| Basques | 22.5 /100 | #201 | Fair 6.8% |
| Immigrants | Argentina | 21.6 /100 | #202 | Fair 6.8% |
| Immigrants | Norway | 21.2 /100 | #203 | Fair 6.8% |
Demographics Similar to Alaska Natives by Unemployment Among Ages 25 to 29 years
In terms of unemployment among ages 25 to 29 years, the demographic groups most similar to Alaska Natives are Pueblo (10.4%, a difference of 2.3%), Native/Alaskan (9.8%, a difference of 3.7%), Aleut (9.7%, a difference of 5.2%), Alaskan Athabascan (10.8%, a difference of 5.8%), and Apache (9.5%, a difference of 7.5%).
| Demographics | Rating | Rank | Unemployment Among Ages 25 to 29 years |
| Houma | 0.0 /100 | #324 | Tragic 8.7% |
| Yakama | 0.0 /100 | #325 | Tragic 8.8% |
| Shoshone | 0.0 /100 | #326 | Tragic 9.2% |
| Colville | 0.0 /100 | #327 | Tragic 9.2% |
| Apache | 0.0 /100 | #328 | Tragic 9.5% |
| Aleuts | 0.0 /100 | #329 | Tragic 9.7% |
| Natives/Alaskans | 0.0 /100 | #330 | Tragic 9.8% |
| Alaska Natives | 0.0 /100 | #331 | Tragic 10.2% |
| Pueblo | 0.0 /100 | #332 | Tragic 10.4% |
| Alaskan Athabascans | 0.0 /100 | #333 | Tragic 10.8% |
| Yuman | 0.0 /100 | #334 | Tragic 11.0% |
| Puerto Ricans | 0.0 /100 | #335 | Tragic 11.1% |
| Lumbee | 0.0 /100 | #336 | Tragic 11.2% |
| Menominee | 0.0 /100 | #337 | Tragic 11.3% |
| Sioux | 0.0 /100 | #338 | Tragic 11.7% |