Immigrants from Hong Kong vs Immigrants from Eastern Europe 11th Grade
COMPARE
Immigrants from Hong Kong
Immigrants from Eastern Europe
11th Grade
11th Grade Comparison
Immigrants from Hong Kong
Immigrants from Eastern Europe
92.2%
11TH GRADE
23.3/ 100
METRIC RATING
204th/ 347
METRIC RANK
93.2%
11TH GRADE
95.9/ 100
METRIC RATING
124th/ 347
METRIC RANK
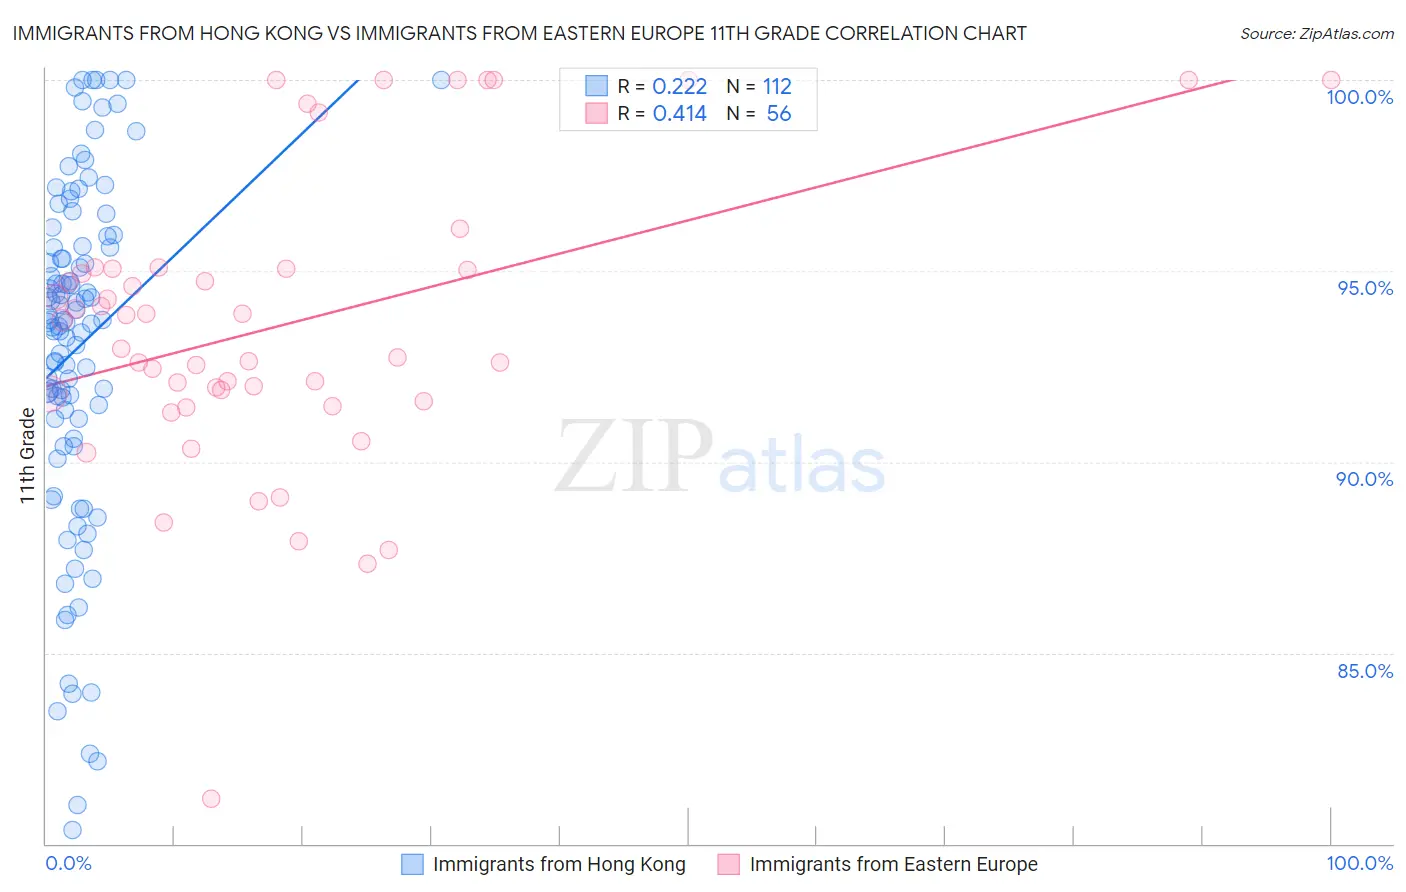
Immigrants from Hong Kong vs Immigrants from Eastern Europe 11th Grade Correlation Chart
The statistical analysis conducted on geographies consisting of 253,990,250 people shows a weak positive correlation between the proportion of Immigrants from Hong Kong and percentage of population with at least 11th grade education in the United States with a correlation coefficient (R) of 0.222 and weighted average of 92.2%. Similarly, the statistical analysis conducted on geographies consisting of 475,879,420 people shows a moderate positive correlation between the proportion of Immigrants from Eastern Europe and percentage of population with at least 11th grade education in the United States with a correlation coefficient (R) of 0.414 and weighted average of 93.2%, a difference of 1.1%.
11th Grade Correlation Summary
| Measurement | Immigrants from Hong Kong | Immigrants from Eastern Europe |
| Minimum | 80.4% | 81.2% |
| Maximum | 100.0% | 100.0% |
| Range | 19.6% | 18.8% |
| Mean | 93.0% | 93.6% |
| Median | 93.7% | 93.3% |
| Interquartile 25% (IQ1) | 91.1% | 91.7% |
| Interquartile 75% (IQ3) | 95.6% | 95.0% |
| Interquartile Range (IQR) | 4.5% | 3.4% |
| Standard Deviation (Sample) | 4.5% | 3.9% |
| Standard Deviation (Population) | 4.4% | 3.8% |
Similar Demographics by 11th Grade
Demographics Similar to Immigrants from Hong Kong by 11th Grade
In terms of 11th grade, the demographic groups most similar to Immigrants from Hong Kong are Immigrants from Sudan (92.3%, a difference of 0.0%), Kiowa (92.2%, a difference of 0.0%), Bolivian (92.2%, a difference of 0.0%), Immigrants from Eastern Africa (92.3%, a difference of 0.010%), and Immigrants from Oceania (92.2%, a difference of 0.010%).
| Demographics | Rating | Rank | 11th Grade |
| Marshallese | 26.0 /100 | #197 | Fair 92.3% |
| Hawaiians | 25.5 /100 | #198 | Fair 92.3% |
| Immigrants | Uganda | 25.2 /100 | #199 | Fair 92.3% |
| Samoans | 25.1 /100 | #200 | Fair 92.3% |
| Immigrants | China | 25.1 /100 | #201 | Fair 92.3% |
| Immigrants | Eastern Africa | 24.1 /100 | #202 | Fair 92.3% |
| Immigrants | Sudan | 23.5 /100 | #203 | Fair 92.3% |
| Immigrants | Hong Kong | 23.3 /100 | #204 | Fair 92.2% |
| Kiowa | 23.2 /100 | #205 | Fair 92.2% |
| Bolivians | 23.2 /100 | #206 | Fair 92.2% |
| Immigrants | Oceania | 22.4 /100 | #207 | Fair 92.2% |
| Colville | 21.8 /100 | #208 | Fair 92.2% |
| Tongans | 19.8 /100 | #209 | Poor 92.2% |
| Ethiopians | 18.8 /100 | #210 | Poor 92.2% |
| Immigrants | Micronesia | 17.7 /100 | #211 | Poor 92.2% |
Demographics Similar to Immigrants from Eastern Europe by 11th Grade
In terms of 11th grade, the demographic groups most similar to Immigrants from Eastern Europe are Immigrants from Greece (93.2%, a difference of 0.0%), Immigrants from Sri Lanka (93.2%, a difference of 0.020%), German Russian (93.3%, a difference of 0.030%), Immigrants from Belarus (93.3%, a difference of 0.030%), and Basque (93.2%, a difference of 0.040%).
| Demographics | Rating | Rank | 11th Grade |
| Whites/Caucasians | 97.4 /100 | #117 | Exceptional 93.3% |
| Immigrants | Korea | 97.0 /100 | #118 | Exceptional 93.3% |
| Israelis | 97.0 /100 | #119 | Exceptional 93.3% |
| Immigrants | Russia | 96.6 /100 | #120 | Exceptional 93.3% |
| German Russians | 96.4 /100 | #121 | Exceptional 93.3% |
| Immigrants | Belarus | 96.3 /100 | #122 | Exceptional 93.3% |
| Immigrants | Greece | 95.9 /100 | #123 | Exceptional 93.2% |
| Immigrants | Eastern Europe | 95.9 /100 | #124 | Exceptional 93.2% |
| Immigrants | Sri Lanka | 95.6 /100 | #125 | Exceptional 93.2% |
| Basques | 95.2 /100 | #126 | Exceptional 93.2% |
| Immigrants | Kazakhstan | 92.4 /100 | #127 | Exceptional 93.1% |
| Immigrants | Jordan | 92.4 /100 | #128 | Exceptional 93.1% |
| Immigrants | Ukraine | 89.8 /100 | #129 | Excellent 93.0% |
| Albanians | 89.5 /100 | #130 | Excellent 93.0% |
| Egyptians | 89.5 /100 | #131 | Excellent 93.0% |