Immigrants from Hong Kong vs Immigrants from Cameroon Unemployment Among Seniors over 75 years
COMPARE
Immigrants from Hong Kong
Immigrants from Cameroon
Unemployment Among Seniors over 75 years
Unemployment Among Seniors over 75 years Comparison
Immigrants from Hong Kong
Immigrants from Cameroon
7.6%
UNEMPLOYMENT AMONG SENIORS OVER 75 YEARS
100.0/ 100
METRIC RATING
32nd/ 347
METRIC RANK
9.3%
UNEMPLOYMENT AMONG SENIORS OVER 75 YEARS
1.0/ 100
METRIC RATING
260th/ 347
METRIC RANK
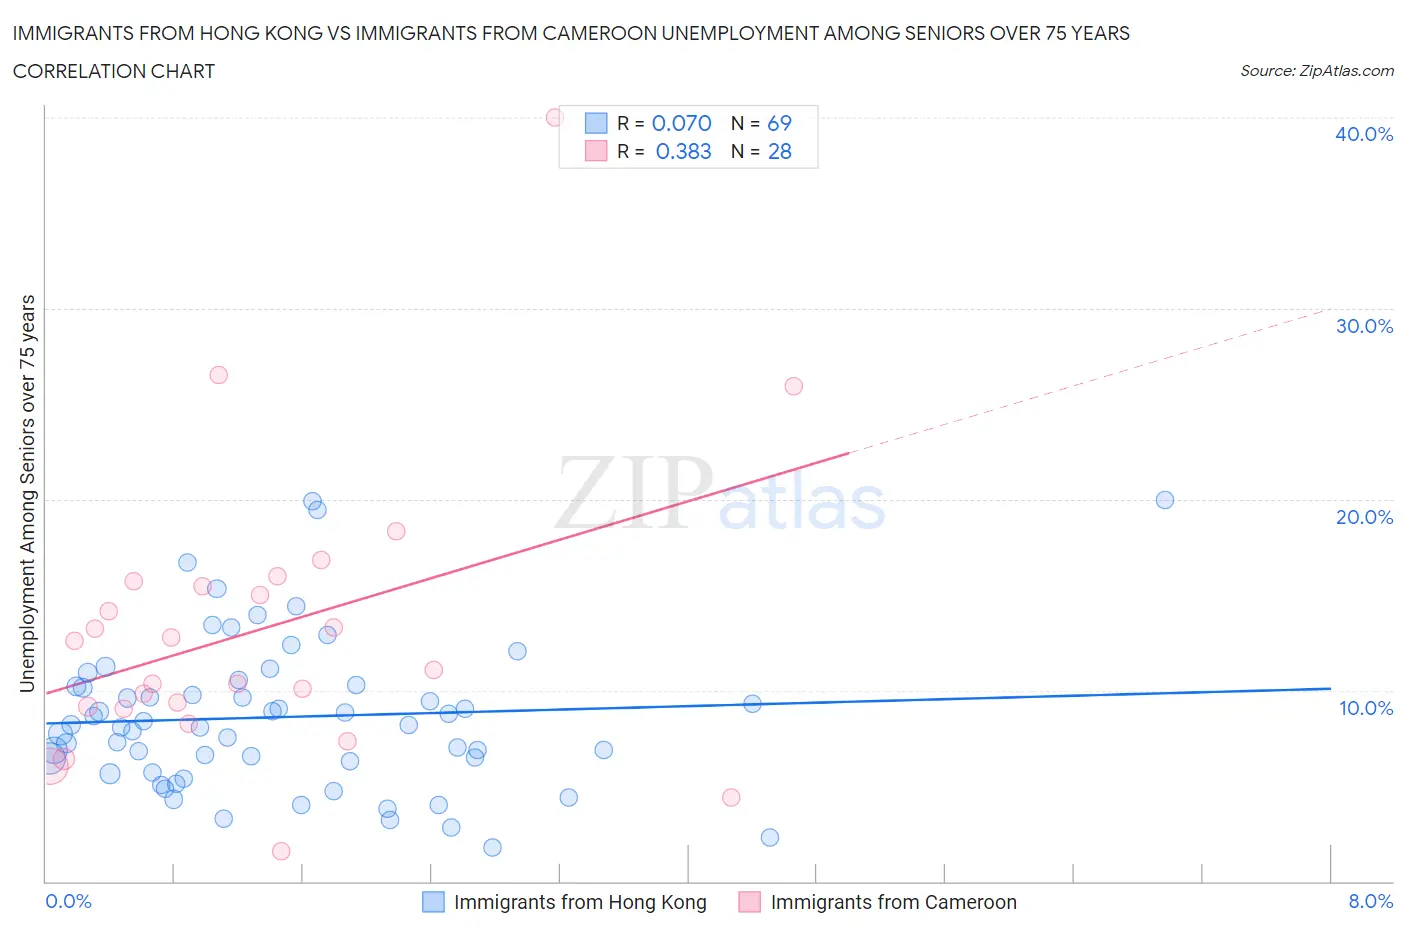
Immigrants from Hong Kong vs Immigrants from Cameroon Unemployment Among Seniors over 75 years Correlation Chart
The statistical analysis conducted on geographies consisting of 155,108,778 people shows a slight positive correlation between the proportion of Immigrants from Hong Kong and unemployment rate among seniors over the age of 75 in the United States with a correlation coefficient (R) of 0.070 and weighted average of 7.6%. Similarly, the statistical analysis conducted on geographies consisting of 92,761,505 people shows a mild positive correlation between the proportion of Immigrants from Cameroon and unemployment rate among seniors over the age of 75 in the United States with a correlation coefficient (R) of 0.383 and weighted average of 9.3%, a difference of 21.4%.
Unemployment Among Seniors over 75 years Correlation Summary
| Measurement | Immigrants from Hong Kong | Immigrants from Cameroon |
| Minimum | 1.8% | 1.6% |
| Maximum | 20.0% | 40.0% |
| Range | 18.2% | 38.4% |
| Mean | 8.6% | 13.2% |
| Median | 8.2% | 11.8% |
| Interquartile 25% (IQ1) | 6.0% | 9.1% |
| Interquartile 75% (IQ3) | 10.2% | 15.6% |
| Interquartile Range (IQR) | 4.3% | 6.5% |
| Standard Deviation (Sample) | 4.0% | 7.6% |
| Standard Deviation (Population) | 4.0% | 7.5% |
Similar Demographics by Unemployment Among Seniors over 75 years
Demographics Similar to Immigrants from Hong Kong by Unemployment Among Seniors over 75 years
In terms of unemployment among seniors over 75 years, the demographic groups most similar to Immigrants from Hong Kong are Cambodian (7.6%, a difference of 0.010%), Immigrants from Eritrea (7.7%, a difference of 0.25%), Immigrants from Norway (7.7%, a difference of 0.46%), Guyanese (7.6%, a difference of 0.50%), and Luxembourger (7.7%, a difference of 0.56%).
| Demographics | Rating | Rank | Unemployment Among Seniors over 75 years |
| Immigrants | Uruguay | 100.0 /100 | #25 | Exceptional 7.5% |
| South Africans | 100.0 /100 | #26 | Exceptional 7.5% |
| Immigrants | Barbados | 100.0 /100 | #27 | Exceptional 7.6% |
| Immigrants | Israel | 100.0 /100 | #28 | Exceptional 7.6% |
| Immigrants | Iran | 100.0 /100 | #29 | Exceptional 7.6% |
| Immigrants | Sweden | 100.0 /100 | #30 | Exceptional 7.6% |
| Guyanese | 100.0 /100 | #31 | Exceptional 7.6% |
| Immigrants | Hong Kong | 100.0 /100 | #32 | Exceptional 7.6% |
| Cambodians | 100.0 /100 | #33 | Exceptional 7.6% |
| Immigrants | Eritrea | 100.0 /100 | #34 | Exceptional 7.7% |
| Immigrants | Norway | 100.0 /100 | #35 | Exceptional 7.7% |
| Luxembourgers | 100.0 /100 | #36 | Exceptional 7.7% |
| Immigrants | Hungary | 100.0 /100 | #37 | Exceptional 7.7% |
| Kiowa | 100.0 /100 | #38 | Exceptional 7.7% |
| Ugandans | 100.0 /100 | #39 | Exceptional 7.7% |
Demographics Similar to Immigrants from Cameroon by Unemployment Among Seniors over 75 years
In terms of unemployment among seniors over 75 years, the demographic groups most similar to Immigrants from Cameroon are Slovene (9.3%, a difference of 0.050%), Immigrants from England (9.3%, a difference of 0.060%), Hawaiian (9.3%, a difference of 0.21%), Celtic (9.3%, a difference of 0.26%), and Brazilian (9.3%, a difference of 0.33%).
| Demographics | Rating | Rank | Unemployment Among Seniors over 75 years |
| Pima | 1.8 /100 | #253 | Tragic 9.2% |
| Immigrants | Ghana | 1.7 /100 | #254 | Tragic 9.2% |
| Immigrants | Scotland | 1.4 /100 | #255 | Tragic 9.2% |
| Brazilians | 1.3 /100 | #256 | Tragic 9.3% |
| Hawaiians | 1.2 /100 | #257 | Tragic 9.3% |
| Immigrants | England | 1.0 /100 | #258 | Tragic 9.3% |
| Slovenes | 1.0 /100 | #259 | Tragic 9.3% |
| Immigrants | Cameroon | 1.0 /100 | #260 | Tragic 9.3% |
| Celtics | 0.8 /100 | #261 | Tragic 9.3% |
| Austrians | 0.7 /100 | #262 | Tragic 9.3% |
| Ukrainians | 0.7 /100 | #263 | Tragic 9.3% |
| Iroquois | 0.7 /100 | #264 | Tragic 9.3% |
| Palestinians | 0.6 /100 | #265 | Tragic 9.3% |
| Blacks/African Americans | 0.5 /100 | #266 | Tragic 9.4% |
| Immigrants | Mexico | 0.4 /100 | #267 | Tragic 9.4% |