Mexican American Indian vs Immigrants from Cameroon Unemployment Among Seniors over 75 years
COMPARE
Mexican American Indian
Immigrants from Cameroon
Unemployment Among Seniors over 75 years
Unemployment Among Seniors over 75 years Comparison
Mexican American Indians
Immigrants from Cameroon
8.8%
UNEMPLOYMENT AMONG SENIORS OVER 75 YEARS
34.7/ 100
METRIC RATING
190th/ 347
METRIC RANK
9.3%
UNEMPLOYMENT AMONG SENIORS OVER 75 YEARS
1.0/ 100
METRIC RATING
260th/ 347
METRIC RANK
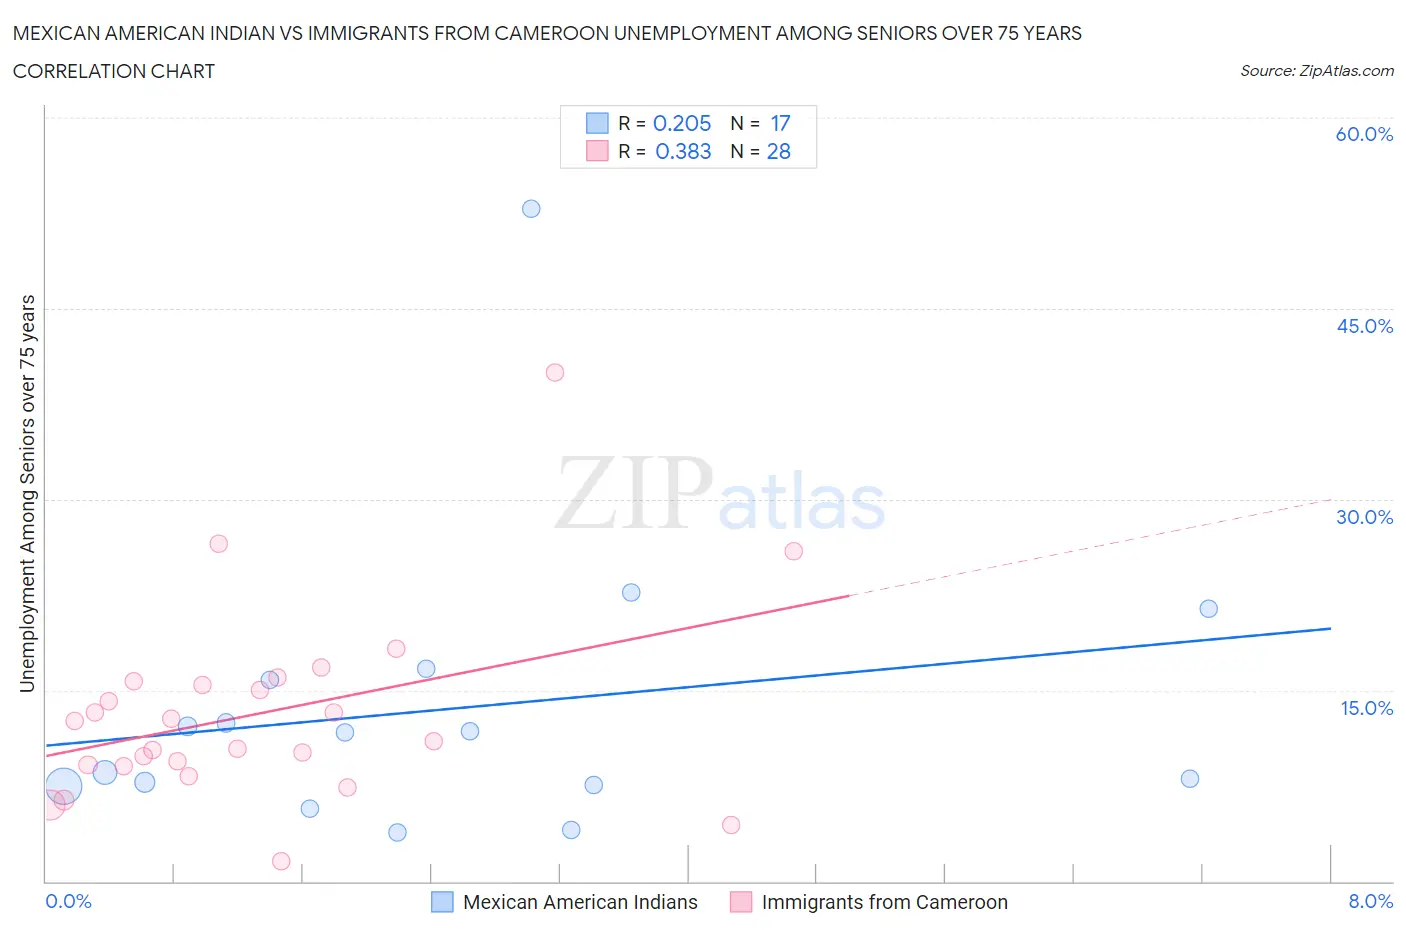
Mexican American Indian vs Immigrants from Cameroon Unemployment Among Seniors over 75 years Correlation Chart
The statistical analysis conducted on geographies consisting of 172,243,221 people shows a weak positive correlation between the proportion of Mexican American Indians and unemployment rate among seniors over the age of 75 in the United States with a correlation coefficient (R) of 0.205 and weighted average of 8.8%. Similarly, the statistical analysis conducted on geographies consisting of 92,761,505 people shows a mild positive correlation between the proportion of Immigrants from Cameroon and unemployment rate among seniors over the age of 75 in the United States with a correlation coefficient (R) of 0.383 and weighted average of 9.3%, a difference of 5.3%.
Unemployment Among Seniors over 75 years Correlation Summary
| Measurement | Mexican American Indian | Immigrants from Cameroon |
| Minimum | 3.8% | 1.6% |
| Maximum | 52.9% | 40.0% |
| Range | 49.1% | 38.4% |
| Mean | 13.6% | 13.2% |
| Median | 11.7% | 11.8% |
| Interquartile 25% (IQ1) | 7.5% | 9.1% |
| Interquartile 75% (IQ3) | 16.3% | 15.6% |
| Interquartile Range (IQR) | 8.8% | 6.5% |
| Standard Deviation (Sample) | 11.5% | 7.6% |
| Standard Deviation (Population) | 11.2% | 7.5% |
Similar Demographics by Unemployment Among Seniors over 75 years
Demographics Similar to Mexican American Indians by Unemployment Among Seniors over 75 years
In terms of unemployment among seniors over 75 years, the demographic groups most similar to Mexican American Indians are Immigrants from Eastern Europe (8.8%, a difference of 0.0%), Immigrants from Haiti (8.8%, a difference of 0.0%), Immigrants from Europe (8.8%, a difference of 0.030%), Estonian (8.8%, a difference of 0.080%), and Immigrants from Ethiopia (8.8%, a difference of 0.090%).
| Demographics | Rating | Rank | Unemployment Among Seniors over 75 years |
| Immigrants | Afghanistan | 38.2 /100 | #183 | Fair 8.8% |
| Immigrants | Micronesia | 37.2 /100 | #184 | Fair 8.8% |
| Choctaw | 37.1 /100 | #185 | Fair 8.8% |
| Immigrants | Ethiopia | 36.2 /100 | #186 | Fair 8.8% |
| Immigrants | Europe | 35.2 /100 | #187 | Fair 8.8% |
| Immigrants | Eastern Europe | 34.7 /100 | #188 | Fair 8.8% |
| Immigrants | Haiti | 34.7 /100 | #189 | Fair 8.8% |
| Mexican American Indians | 34.7 /100 | #190 | Fair 8.8% |
| Estonians | 33.3 /100 | #191 | Fair 8.8% |
| Immigrants | Kenya | 31.8 /100 | #192 | Fair 8.8% |
| Immigrants | Guyana | 29.9 /100 | #193 | Fair 8.8% |
| Maltese | 29.2 /100 | #194 | Fair 8.8% |
| Okinawans | 28.9 /100 | #195 | Fair 8.8% |
| Immigrants | Jamaica | 27.7 /100 | #196 | Fair 8.9% |
| Immigrants | Laos | 26.3 /100 | #197 | Fair 8.9% |
Demographics Similar to Immigrants from Cameroon by Unemployment Among Seniors over 75 years
In terms of unemployment among seniors over 75 years, the demographic groups most similar to Immigrants from Cameroon are Slovene (9.3%, a difference of 0.050%), Immigrants from England (9.3%, a difference of 0.060%), Hawaiian (9.3%, a difference of 0.21%), Celtic (9.3%, a difference of 0.26%), and Brazilian (9.3%, a difference of 0.33%).
| Demographics | Rating | Rank | Unemployment Among Seniors over 75 years |
| Pima | 1.8 /100 | #253 | Tragic 9.2% |
| Immigrants | Ghana | 1.7 /100 | #254 | Tragic 9.2% |
| Immigrants | Scotland | 1.4 /100 | #255 | Tragic 9.2% |
| Brazilians | 1.3 /100 | #256 | Tragic 9.3% |
| Hawaiians | 1.2 /100 | #257 | Tragic 9.3% |
| Immigrants | England | 1.0 /100 | #258 | Tragic 9.3% |
| Slovenes | 1.0 /100 | #259 | Tragic 9.3% |
| Immigrants | Cameroon | 1.0 /100 | #260 | Tragic 9.3% |
| Celtics | 0.8 /100 | #261 | Tragic 9.3% |
| Austrians | 0.7 /100 | #262 | Tragic 9.3% |
| Ukrainians | 0.7 /100 | #263 | Tragic 9.3% |
| Iroquois | 0.7 /100 | #264 | Tragic 9.3% |
| Palestinians | 0.6 /100 | #265 | Tragic 9.3% |
| Blacks/African Americans | 0.5 /100 | #266 | Tragic 9.4% |
| Immigrants | Mexico | 0.4 /100 | #267 | Tragic 9.4% |