Immigrants from Haiti vs Aleut Female Unemployment
COMPARE
Immigrants from Haiti
Aleut
Female Unemployment
Female Unemployment Comparison
Immigrants from Haiti
Aleuts
6.1%
FEMALE UNEMPLOYMENT
0.0/ 100
METRIC RATING
300th/ 347
METRIC RANK
5.5%
FEMALE UNEMPLOYMENT
3.0/ 100
METRIC RATING
239th/ 347
METRIC RANK
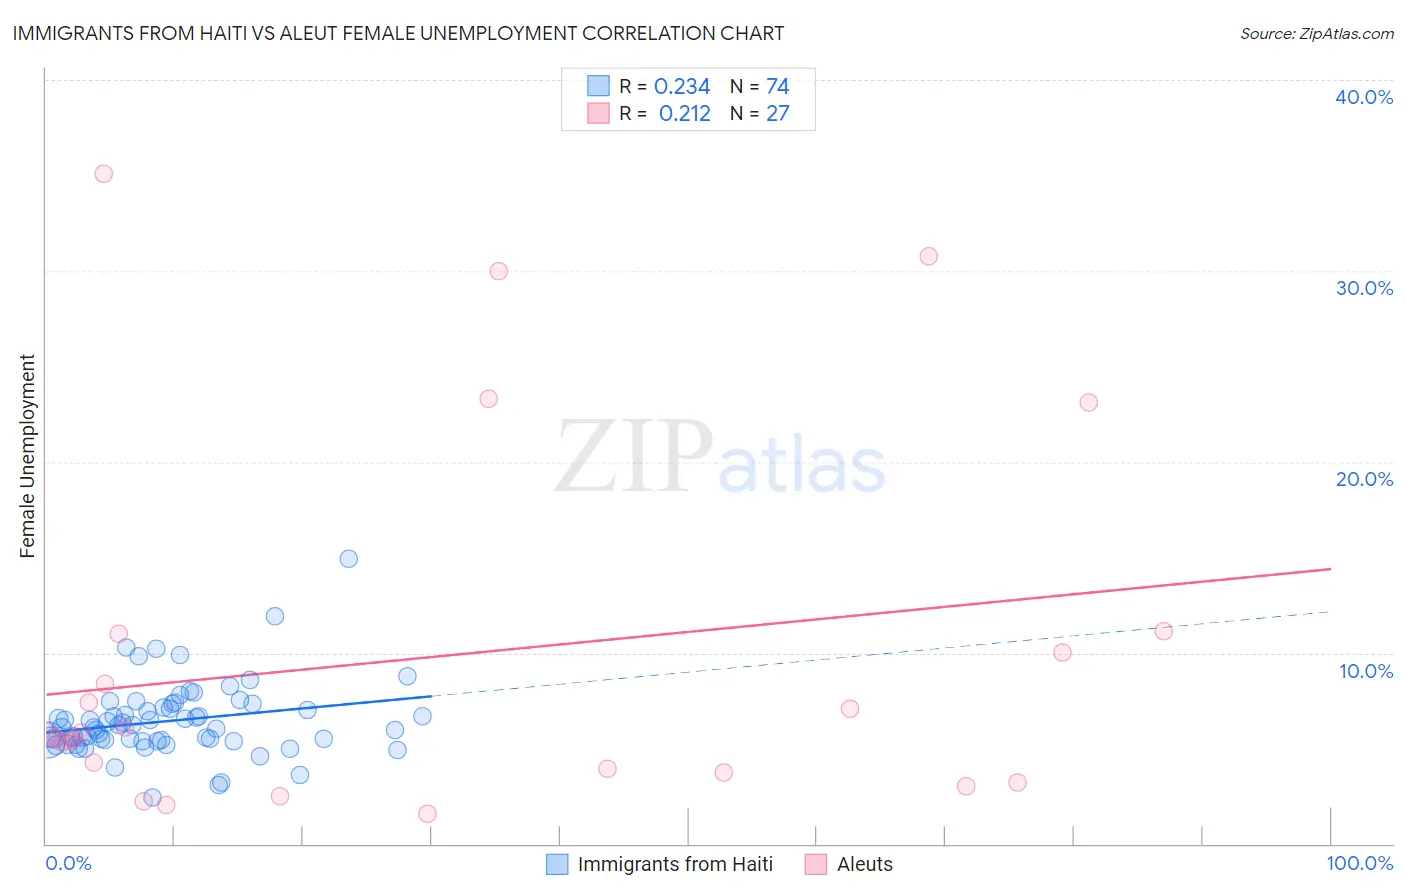
Immigrants from Haiti vs Aleut Female Unemployment Correlation Chart
The statistical analysis conducted on geographies consisting of 224,784,529 people shows a weak positive correlation between the proportion of Immigrants from Haiti and unemploymnet rate among females in the United States with a correlation coefficient (R) of 0.234 and weighted average of 6.1%. Similarly, the statistical analysis conducted on geographies consisting of 61,655,077 people shows a weak positive correlation between the proportion of Aleuts and unemploymnet rate among females in the United States with a correlation coefficient (R) of 0.212 and weighted average of 5.5%, a difference of 10.8%.
Female Unemployment Correlation Summary
| Measurement | Immigrants from Haiti | Aleut |
| Minimum | 2.4% | 1.6% |
| Maximum | 14.9% | 35.1% |
| Range | 12.5% | 33.5% |
| Mean | 6.4% | 9.7% |
| Median | 6.1% | 5.7% |
| Interquartile 25% (IQ1) | 5.4% | 3.7% |
| Interquartile 75% (IQ3) | 7.1% | 11.0% |
| Interquartile Range (IQR) | 1.7% | 7.3% |
| Standard Deviation (Sample) | 1.9% | 9.7% |
| Standard Deviation (Population) | 1.9% | 9.5% |
Similar Demographics by Female Unemployment
Demographics Similar to Immigrants from Haiti by Female Unemployment
In terms of female unemployment, the demographic groups most similar to Immigrants from Haiti are Ute (6.1%, a difference of 0.040%), Jamaican (6.1%, a difference of 0.15%), West Indian (6.1%, a difference of 0.17%), Alaskan Athabascan (6.1%, a difference of 0.18%), and Immigrants from Latin America (6.1%, a difference of 0.20%).
| Demographics | Rating | Rank | Female Unemployment |
| Mexicans | 0.0 /100 | #293 | Tragic 6.1% |
| Immigrants | El Salvador | 0.0 /100 | #294 | Tragic 6.1% |
| Immigrants | Latin America | 0.0 /100 | #295 | Tragic 6.1% |
| Alaskan Athabascans | 0.0 /100 | #296 | Tragic 6.1% |
| West Indians | 0.0 /100 | #297 | Tragic 6.1% |
| Jamaicans | 0.0 /100 | #298 | Tragic 6.1% |
| Ute | 0.0 /100 | #299 | Tragic 6.1% |
| Immigrants | Haiti | 0.0 /100 | #300 | Tragic 6.1% |
| Immigrants | Barbados | 0.0 /100 | #301 | Tragic 6.2% |
| U.S. Virgin Islanders | 0.0 /100 | #302 | Tragic 6.2% |
| Barbadians | 0.0 /100 | #303 | Tragic 6.2% |
| Immigrants | Jamaica | 0.0 /100 | #304 | Tragic 6.2% |
| Spanish American Indians | 0.0 /100 | #305 | Tragic 6.2% |
| Immigrants | Central America | 0.0 /100 | #306 | Tragic 6.2% |
| Shoshone | 0.0 /100 | #307 | Tragic 6.2% |
Demographics Similar to Aleuts by Female Unemployment
In terms of female unemployment, the demographic groups most similar to Aleuts are Immigrants from South America (5.5%, a difference of 0.040%), South American Indian (5.5%, a difference of 0.080%), Sierra Leonean (5.5%, a difference of 0.10%), Immigrants from Panama (5.5%, a difference of 0.12%), and Immigrants from Cambodia (5.5%, a difference of 0.14%).
| Demographics | Rating | Rank | Female Unemployment |
| Liberians | 3.9 /100 | #232 | Tragic 5.5% |
| Moroccans | 3.4 /100 | #233 | Tragic 5.5% |
| Immigrants | Lebanon | 3.3 /100 | #234 | Tragic 5.5% |
| Immigrants | Iran | 3.3 /100 | #235 | Tragic 5.5% |
| Immigrants | Cambodia | 3.3 /100 | #236 | Tragic 5.5% |
| Immigrants | Panama | 3.2 /100 | #237 | Tragic 5.5% |
| Sierra Leoneans | 3.2 /100 | #238 | Tragic 5.5% |
| Aleuts | 3.0 /100 | #239 | Tragic 5.5% |
| Immigrants | South America | 2.9 /100 | #240 | Tragic 5.5% |
| South American Indians | 2.8 /100 | #241 | Tragic 5.5% |
| Marshallese | 2.3 /100 | #242 | Tragic 5.6% |
| Spanish Americans | 2.2 /100 | #243 | Tragic 5.6% |
| Immigrants | Liberia | 1.5 /100 | #244 | Tragic 5.6% |
| Guamanians/Chamorros | 1.4 /100 | #245 | Tragic 5.6% |
| Japanese | 1.2 /100 | #246 | Tragic 5.6% |