Immigrants from Cuba vs Aleut Female Unemployment
COMPARE
Immigrants from Cuba
Aleut
Female Unemployment
Female Unemployment Comparison
Immigrants from Cuba
Aleuts
4.9%
FEMALE UNEMPLOYMENT
99.1/ 100
METRIC RATING
50th/ 347
METRIC RANK
5.5%
FEMALE UNEMPLOYMENT
3.0/ 100
METRIC RATING
239th/ 347
METRIC RANK
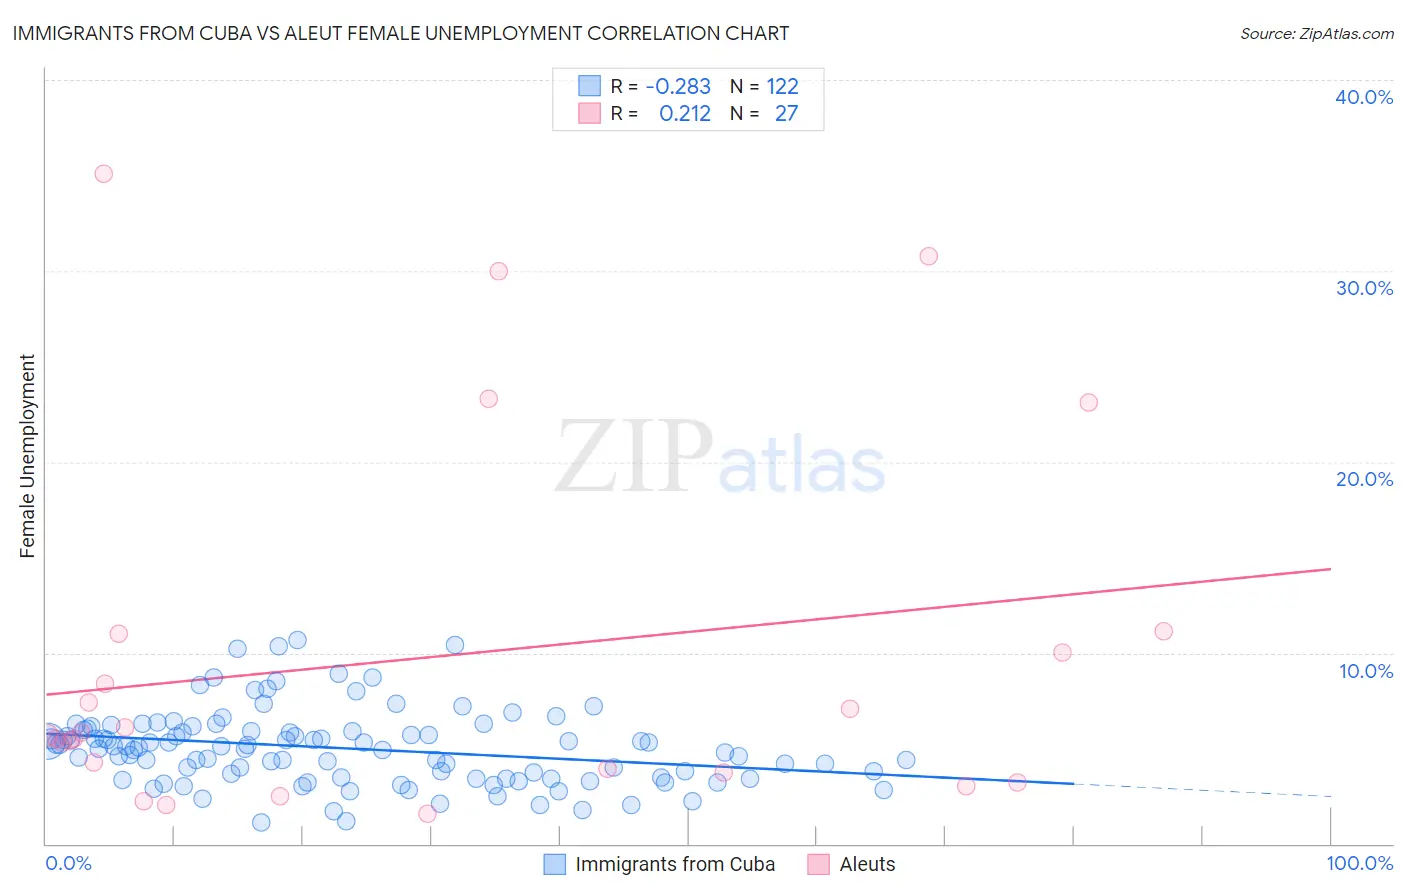
Immigrants from Cuba vs Aleut Female Unemployment Correlation Chart
The statistical analysis conducted on geographies consisting of 325,054,081 people shows a weak negative correlation between the proportion of Immigrants from Cuba and unemploymnet rate among females in the United States with a correlation coefficient (R) of -0.283 and weighted average of 4.9%. Similarly, the statistical analysis conducted on geographies consisting of 61,655,077 people shows a weak positive correlation between the proportion of Aleuts and unemploymnet rate among females in the United States with a correlation coefficient (R) of 0.212 and weighted average of 5.5%, a difference of 13.2%.
Female Unemployment Correlation Summary
| Measurement | Immigrants from Cuba | Aleut |
| Minimum | 1.1% | 1.6% |
| Maximum | 10.7% | 35.1% |
| Range | 9.6% | 33.5% |
| Mean | 5.0% | 9.7% |
| Median | 5.1% | 5.7% |
| Interquartile 25% (IQ1) | 3.5% | 3.7% |
| Interquartile 75% (IQ3) | 5.9% | 11.0% |
| Interquartile Range (IQR) | 2.4% | 7.3% |
| Standard Deviation (Sample) | 1.9% | 9.7% |
| Standard Deviation (Population) | 1.9% | 9.5% |
Similar Demographics by Female Unemployment
Demographics Similar to Immigrants from Cuba by Female Unemployment
In terms of female unemployment, the demographic groups most similar to Immigrants from Cuba are Cambodian (4.9%, a difference of 0.020%), Slavic (4.9%, a difference of 0.040%), White/Caucasian (4.9%, a difference of 0.070%), Immigrants from Zimbabwe (4.9%, a difference of 0.13%), and Immigrants from Moldova (4.9%, a difference of 0.14%).
| Demographics | Rating | Rank | Female Unemployment |
| Eastern Europeans | 99.4 /100 | #43 | Exceptional 4.9% |
| Greeks | 99.4 /100 | #44 | Exceptional 4.9% |
| Austrians | 99.3 /100 | #45 | Exceptional 4.9% |
| Immigrants | Bulgaria | 99.3 /100 | #46 | Exceptional 4.9% |
| Okinawans | 99.3 /100 | #47 | Exceptional 4.9% |
| Thais | 99.2 /100 | #48 | Exceptional 4.9% |
| Australians | 99.2 /100 | #49 | Exceptional 4.9% |
| Immigrants | Cuba | 99.1 /100 | #50 | Exceptional 4.9% |
| Cambodians | 99.1 /100 | #51 | Exceptional 4.9% |
| Slavs | 99.1 /100 | #52 | Exceptional 4.9% |
| Whites/Caucasians | 99.0 /100 | #53 | Exceptional 4.9% |
| Immigrants | Zimbabwe | 99.0 /100 | #54 | Exceptional 4.9% |
| Immigrants | Moldova | 99.0 /100 | #55 | Exceptional 4.9% |
| Serbians | 99.0 /100 | #56 | Exceptional 4.9% |
| Icelanders | 98.8 /100 | #57 | Exceptional 4.9% |
Demographics Similar to Aleuts by Female Unemployment
In terms of female unemployment, the demographic groups most similar to Aleuts are Immigrants from South America (5.5%, a difference of 0.040%), South American Indian (5.5%, a difference of 0.080%), Sierra Leonean (5.5%, a difference of 0.10%), Immigrants from Panama (5.5%, a difference of 0.12%), and Immigrants from Cambodia (5.5%, a difference of 0.14%).
| Demographics | Rating | Rank | Female Unemployment |
| Liberians | 3.9 /100 | #232 | Tragic 5.5% |
| Moroccans | 3.4 /100 | #233 | Tragic 5.5% |
| Immigrants | Lebanon | 3.3 /100 | #234 | Tragic 5.5% |
| Immigrants | Iran | 3.3 /100 | #235 | Tragic 5.5% |
| Immigrants | Cambodia | 3.3 /100 | #236 | Tragic 5.5% |
| Immigrants | Panama | 3.2 /100 | #237 | Tragic 5.5% |
| Sierra Leoneans | 3.2 /100 | #238 | Tragic 5.5% |
| Aleuts | 3.0 /100 | #239 | Tragic 5.5% |
| Immigrants | South America | 2.9 /100 | #240 | Tragic 5.5% |
| South American Indians | 2.8 /100 | #241 | Tragic 5.5% |
| Marshallese | 2.3 /100 | #242 | Tragic 5.6% |
| Spanish Americans | 2.2 /100 | #243 | Tragic 5.6% |
| Immigrants | Liberia | 1.5 /100 | #244 | Tragic 5.6% |
| Guamanians/Chamorros | 1.4 /100 | #245 | Tragic 5.6% |
| Japanese | 1.2 /100 | #246 | Tragic 5.6% |