Immigrants from Greece vs Serbian Unemployment Among Ages 65 to 74 years
COMPARE
Immigrants from Greece
Serbian
Unemployment Among Ages 65 to 74 years
Unemployment Among Ages 65 to 74 years Comparison
Immigrants from Greece
Serbians
5.6%
UNEMPLOYMENT AMONG AGES 65 TO 74 YEARS
0.9/ 100
METRIC RATING
245th/ 347
METRIC RANK
5.2%
UNEMPLOYMENT AMONG AGES 65 TO 74 YEARS
97.0/ 100
METRIC RATING
95th/ 347
METRIC RANK
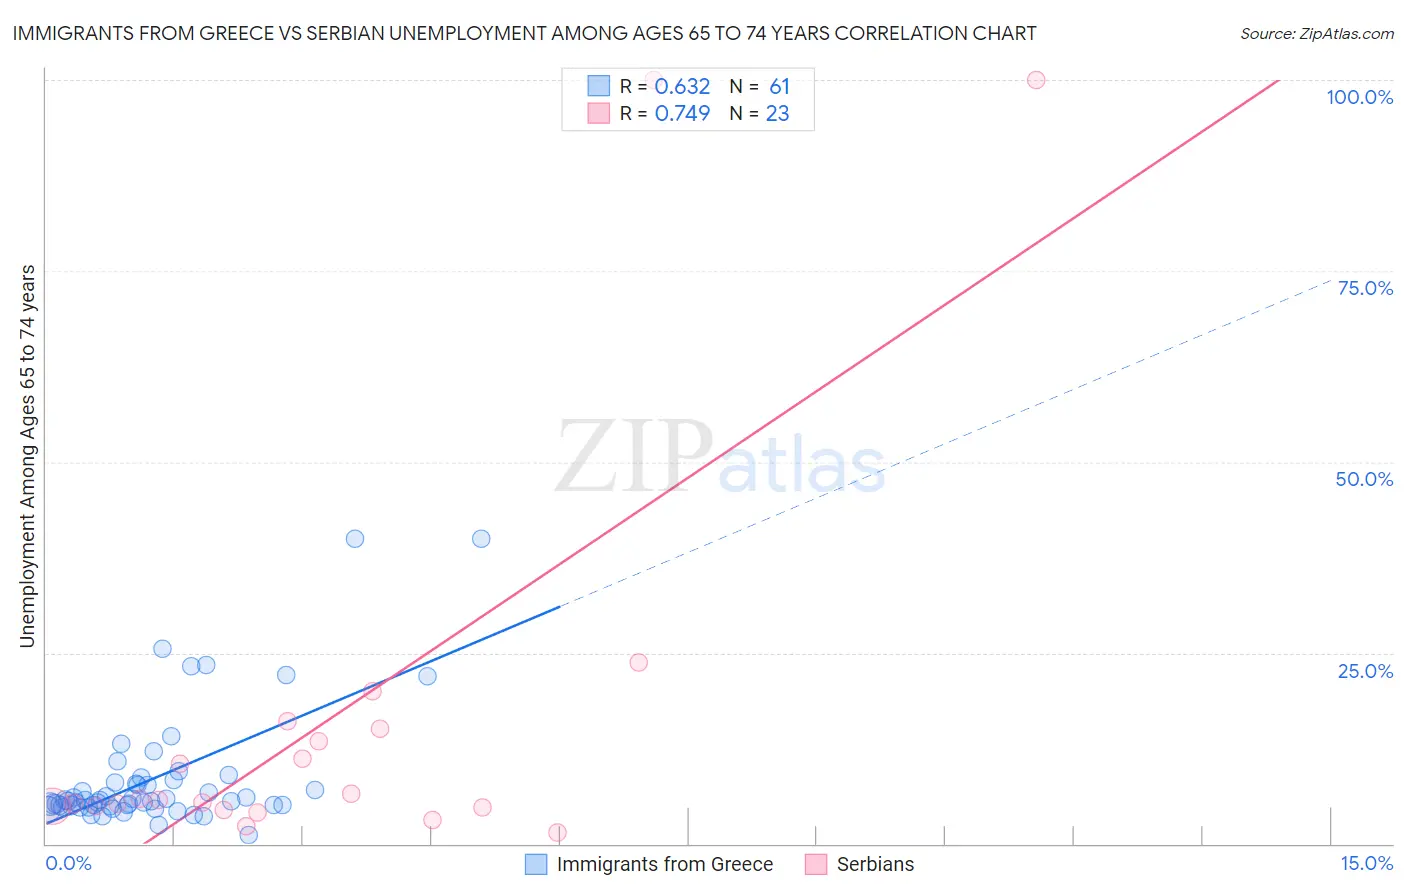
Immigrants from Greece vs Serbian Unemployment Among Ages 65 to 74 years Correlation Chart
The statistical analysis conducted on geographies consisting of 203,377,049 people shows a significant positive correlation between the proportion of Immigrants from Greece and unemployment rate among population between the ages 65 and 74 in the United States with a correlation coefficient (R) of 0.632 and weighted average of 5.6%. Similarly, the statistical analysis conducted on geographies consisting of 243,340,677 people shows a strong positive correlation between the proportion of Serbians and unemployment rate among population between the ages 65 and 74 in the United States with a correlation coefficient (R) of 0.749 and weighted average of 5.2%, a difference of 7.0%.
Unemployment Among Ages 65 to 74 years Correlation Summary
| Measurement | Immigrants from Greece | Serbian |
| Minimum | 1.2% | 1.4% |
| Maximum | 40.0% | 100.0% |
| Range | 38.8% | 98.6% |
| Mean | 8.6% | 16.3% |
| Median | 5.6% | 5.7% |
| Interquartile 25% (IQ1) | 5.0% | 4.8% |
| Interquartile 75% (IQ3) | 8.1% | 15.0% |
| Interquartile Range (IQR) | 3.1% | 10.2% |
| Standard Deviation (Sample) | 7.9% | 27.1% |
| Standard Deviation (Population) | 7.8% | 26.5% |
Similar Demographics by Unemployment Among Ages 65 to 74 years
Demographics Similar to Immigrants from Greece by Unemployment Among Ages 65 to 74 years
In terms of unemployment among ages 65 to 74 years, the demographic groups most similar to Immigrants from Greece are Immigrants from Micronesia (5.6%, a difference of 0.0%), Paraguayan (5.6%, a difference of 0.010%), Immigrants (5.6%, a difference of 0.060%), Immigrants from Argentina (5.6%, a difference of 0.060%), and Trinidadian and Tobagonian (5.6%, a difference of 0.12%).
| Demographics | Rating | Rank | Unemployment Among Ages 65 to 74 years |
| Cajuns | 1.8 /100 | #238 | Tragic 5.5% |
| German Russians | 1.6 /100 | #239 | Tragic 5.5% |
| Ghanaians | 1.4 /100 | #240 | Tragic 5.6% |
| Cree | 1.4 /100 | #241 | Tragic 5.6% |
| Immigrants | Ghana | 1.4 /100 | #242 | Tragic 5.6% |
| Immigrants | Peru | 1.3 /100 | #243 | Tragic 5.6% |
| Immigrants | Micronesia | 0.9 /100 | #244 | Tragic 5.6% |
| Immigrants | Greece | 0.9 /100 | #245 | Tragic 5.6% |
| Paraguayans | 0.9 /100 | #246 | Tragic 5.6% |
| Immigrants | Immigrants | 0.9 /100 | #247 | Tragic 5.6% |
| Immigrants | Argentina | 0.9 /100 | #248 | Tragic 5.6% |
| Trinidadians and Tobagonians | 0.8 /100 | #249 | Tragic 5.6% |
| Cape Verdeans | 0.7 /100 | #250 | Tragic 5.6% |
| Brazilians | 0.5 /100 | #251 | Tragic 5.6% |
| Colombians | 0.5 /100 | #252 | Tragic 5.6% |
Demographics Similar to Serbians by Unemployment Among Ages 65 to 74 years
In terms of unemployment among ages 65 to 74 years, the demographic groups most similar to Serbians are South African (5.2%, a difference of 0.0%), Immigrants from Netherlands (5.2%, a difference of 0.020%), Immigrants from Thailand (5.2%, a difference of 0.020%), Puget Sound Salish (5.2%, a difference of 0.080%), and Romanian (5.2%, a difference of 0.11%).
| Demographics | Rating | Rank | Unemployment Among Ages 65 to 74 years |
| Immigrants | Saudi Arabia | 97.9 /100 | #88 | Exceptional 5.2% |
| English | 97.8 /100 | #89 | Exceptional 5.2% |
| Luxembourgers | 97.6 /100 | #90 | Exceptional 5.2% |
| Romanians | 97.4 /100 | #91 | Exceptional 5.2% |
| Puget Sound Salish | 97.3 /100 | #92 | Exceptional 5.2% |
| Immigrants | Netherlands | 97.1 /100 | #93 | Exceptional 5.2% |
| South Africans | 97.1 /100 | #94 | Exceptional 5.2% |
| Serbians | 97.0 /100 | #95 | Exceptional 5.2% |
| Immigrants | Thailand | 97.0 /100 | #96 | Exceptional 5.2% |
| Senegalese | 96.5 /100 | #97 | Exceptional 5.2% |
| Welsh | 96.5 /100 | #98 | Exceptional 5.2% |
| Burmese | 96.4 /100 | #99 | Exceptional 5.2% |
| Japanese | 96.4 /100 | #100 | Exceptional 5.2% |
| Immigrants | Cambodia | 96.3 /100 | #101 | Exceptional 5.2% |
| Immigrants | Lithuania | 95.9 /100 | #102 | Exceptional 5.2% |