Immigrants from Zimbabwe vs Immigrants from Iraq Unemployment Among Ages 20 to 24 years
COMPARE
Immigrants from Zimbabwe
Immigrants from Iraq
Unemployment Among Ages 20 to 24 years
Unemployment Among Ages 20 to 24 years Comparison
Immigrants from Zimbabwe
Immigrants from Iraq
9.5%
UNEMPLOYMENT AMONG AGES 20 TO 24 YEARS
100.0/ 100
METRIC RATING
27th/ 347
METRIC RANK
10.1%
UNEMPLOYMENT AMONG AGES 20 TO 24 YEARS
87.1/ 100
METRIC RATING
123rd/ 347
METRIC RANK
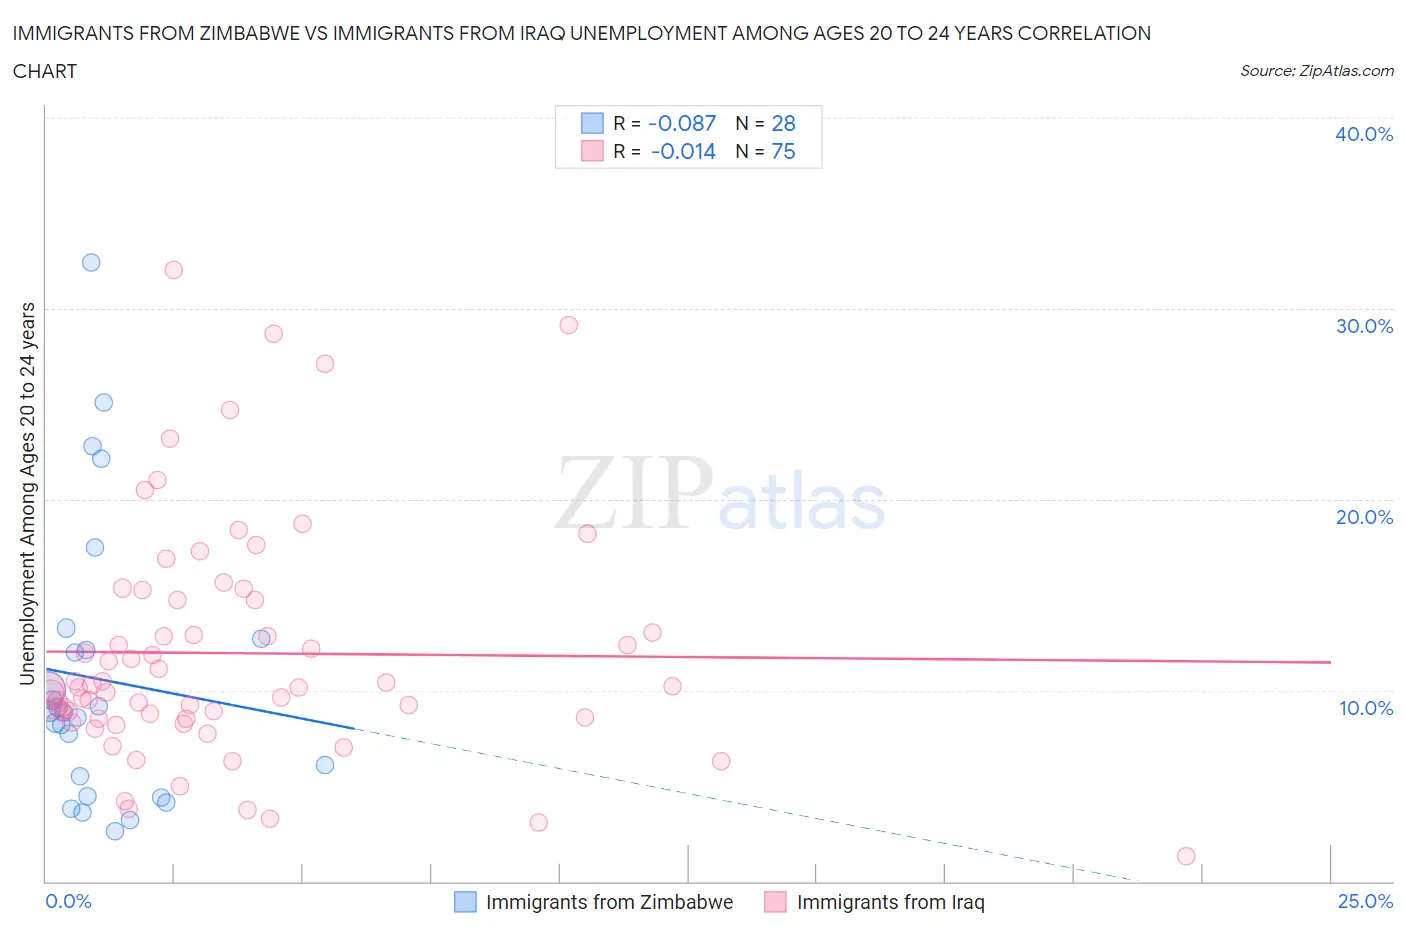
Immigrants from Zimbabwe vs Immigrants from Iraq Unemployment Among Ages 20 to 24 years Correlation Chart
The statistical analysis conducted on geographies consisting of 116,782,368 people shows a slight negative correlation between the proportion of Immigrants from Zimbabwe and unemployment rate among population between the ages 20 and 24 in the United States with a correlation coefficient (R) of -0.087 and weighted average of 9.5%. Similarly, the statistical analysis conducted on geographies consisting of 192,460,138 people shows no correlation between the proportion of Immigrants from Iraq and unemployment rate among population between the ages 20 and 24 in the United States with a correlation coefficient (R) of -0.014 and weighted average of 10.1%, a difference of 6.4%.
Unemployment Among Ages 20 to 24 years Correlation Summary
| Measurement | Immigrants from Zimbabwe | Immigrants from Iraq |
| Minimum | 2.6% | 1.3% |
| Maximum | 32.4% | 32.0% |
| Range | 29.8% | 30.7% |
| Mean | 10.6% | 11.9% |
| Median | 8.9% | 10.2% |
| Interquartile 25% (IQ1) | 5.0% | 8.5% |
| Interquartile 75% (IQ3) | 12.4% | 14.7% |
| Interquartile Range (IQR) | 7.4% | 6.2% |
| Standard Deviation (Sample) | 7.3% | 6.2% |
| Standard Deviation (Population) | 7.2% | 6.1% |
Similar Demographics by Unemployment Among Ages 20 to 24 years
Demographics Similar to Immigrants from Zimbabwe by Unemployment Among Ages 20 to 24 years
In terms of unemployment among ages 20 to 24 years, the demographic groups most similar to Immigrants from Zimbabwe are Immigrants from Afghanistan (9.5%, a difference of 0.080%), Immigrants from North Macedonia (9.5%, a difference of 0.090%), Scandinavian (9.5%, a difference of 0.11%), Immigrants from Eastern Africa (9.5%, a difference of 0.19%), and Cambodian (9.5%, a difference of 0.24%).
| Demographics | Rating | Rank | Unemployment Among Ages 20 to 24 years |
| Osage | 100.0 /100 | #20 | Exceptional 9.4% |
| Immigrants | Bosnia and Herzegovina | 100.0 /100 | #21 | Exceptional 9.4% |
| Tongans | 100.0 /100 | #22 | Exceptional 9.4% |
| Immigrants | Nepal | 100.0 /100 | #23 | Exceptional 9.4% |
| Taiwanese | 100.0 /100 | #24 | Exceptional 9.4% |
| Immigrants | Eritrea | 100.0 /100 | #25 | Exceptional 9.5% |
| Swedes | 100.0 /100 | #26 | Exceptional 9.5% |
| Immigrants | Zimbabwe | 100.0 /100 | #27 | Exceptional 9.5% |
| Immigrants | Afghanistan | 100.0 /100 | #28 | Exceptional 9.5% |
| Immigrants | North Macedonia | 100.0 /100 | #29 | Exceptional 9.5% |
| Scandinavians | 100.0 /100 | #30 | Exceptional 9.5% |
| Immigrants | Eastern Africa | 100.0 /100 | #31 | Exceptional 9.5% |
| Cambodians | 100.0 /100 | #32 | Exceptional 9.5% |
| Australians | 100.0 /100 | #33 | Exceptional 9.6% |
| Yugoslavians | 100.0 /100 | #34 | Exceptional 9.6% |
Demographics Similar to Immigrants from Iraq by Unemployment Among Ages 20 to 24 years
In terms of unemployment among ages 20 to 24 years, the demographic groups most similar to Immigrants from Iraq are White/Caucasian (10.1%, a difference of 0.020%), Immigrants from Japan (10.1%, a difference of 0.050%), South African (10.1%, a difference of 0.060%), Spanish (10.1%, a difference of 0.080%), and Jordanian (10.1%, a difference of 0.080%).
| Demographics | Rating | Rank | Unemployment Among Ages 20 to 24 years |
| Basques | 89.8 /100 | #116 | Excellent 10.1% |
| Immigrants | Uruguay | 89.6 /100 | #117 | Excellent 10.1% |
| Paraguayans | 88.6 /100 | #118 | Excellent 10.1% |
| French | 88.2 /100 | #119 | Excellent 10.1% |
| Immigrants | Canada | 88.2 /100 | #120 | Excellent 10.1% |
| South Africans | 87.8 /100 | #121 | Excellent 10.1% |
| Whites/Caucasians | 87.4 /100 | #122 | Excellent 10.1% |
| Immigrants | Iraq | 87.1 /100 | #123 | Excellent 10.1% |
| Immigrants | Japan | 86.5 /100 | #124 | Excellent 10.1% |
| Spanish | 86.1 /100 | #125 | Excellent 10.1% |
| Jordanians | 86.1 /100 | #126 | Excellent 10.1% |
| Immigrants | Norway | 85.3 /100 | #127 | Excellent 10.1% |
| Immigrants | Brazil | 84.9 /100 | #128 | Excellent 10.1% |
| Immigrants | South Central Asia | 84.6 /100 | #129 | Excellent 10.1% |
| Immigrants | Lithuania | 84.2 /100 | #130 | Excellent 10.1% |