Immigrants from Germany vs French Canadian Disability Age 65 to 74
COMPARE
Immigrants from Germany
French Canadian
Disability Age 65 to 74
Disability Age 65 to 74 Comparison
Immigrants from Germany
French Canadians
23.4%
DISABILITY AGE 65 TO 74
42.5/ 100
METRIC RATING
184th/ 347
METRIC RANK
23.7%
DISABILITY AGE 65 TO 74
24.0/ 100
METRIC RATING
200th/ 347
METRIC RANK
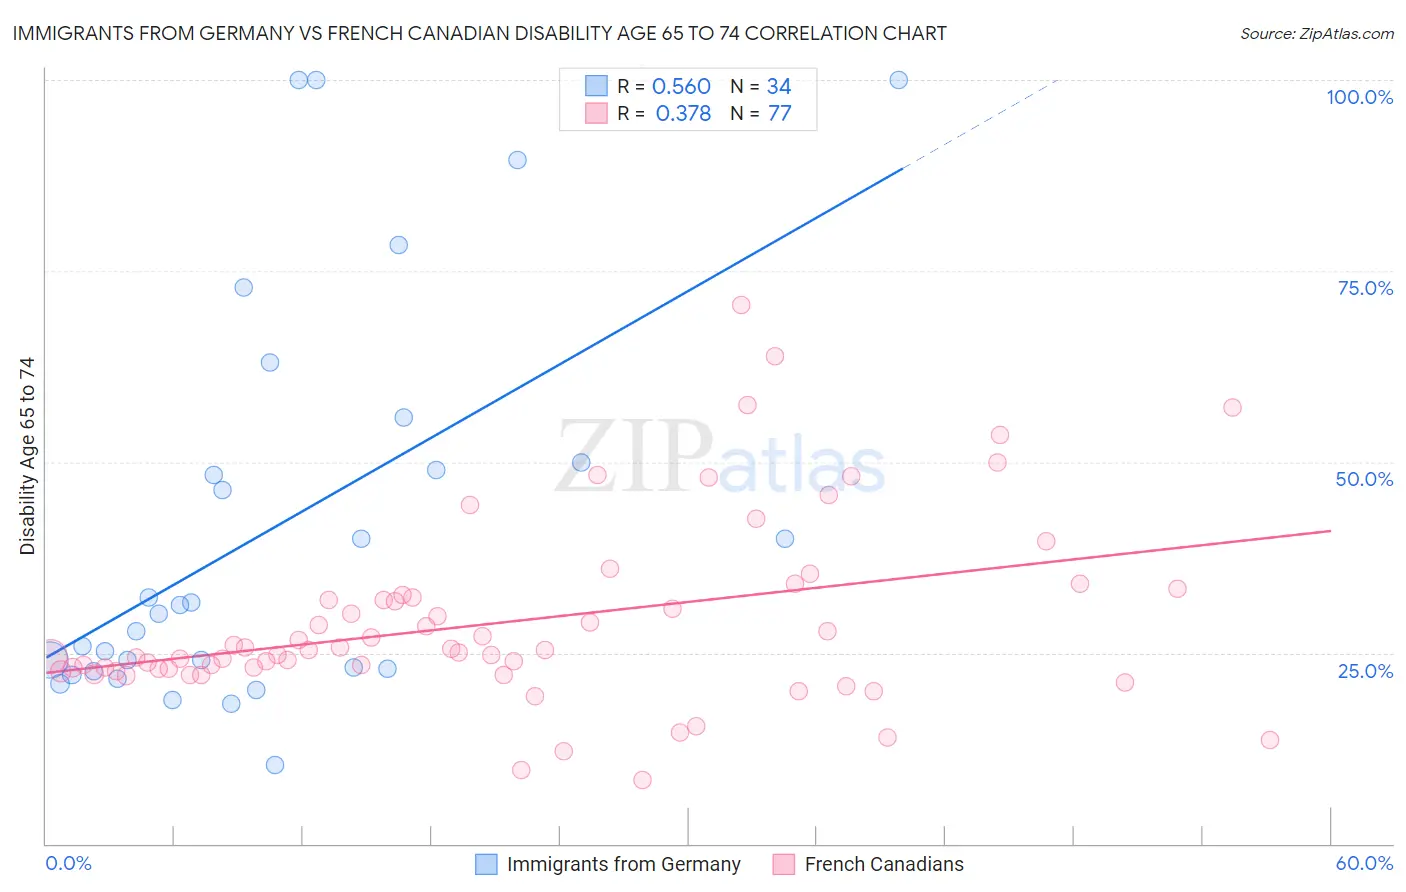
Immigrants from Germany vs French Canadian Disability Age 65 to 74 Correlation Chart
The statistical analysis conducted on geographies consisting of 463,135,745 people shows a substantial positive correlation between the proportion of Immigrants from Germany and percentage of population with a disability between the ages 65 and 75 in the United States with a correlation coefficient (R) of 0.560 and weighted average of 23.4%. Similarly, the statistical analysis conducted on geographies consisting of 501,232,357 people shows a mild positive correlation between the proportion of French Canadians and percentage of population with a disability between the ages 65 and 75 in the United States with a correlation coefficient (R) of 0.378 and weighted average of 23.7%, a difference of 1.2%.
Disability Age 65 to 74 Correlation Summary
| Measurement | Immigrants from Germany | French Canadian |
| Minimum | 10.4% | 8.4% |
| Maximum | 100.0% | 70.6% |
| Range | 89.6% | 62.2% |
| Mean | 41.5% | 29.1% |
| Median | 30.7% | 25.4% |
| Interquartile 25% (IQ1) | 22.9% | 22.8% |
| Interquartile 75% (IQ3) | 50.0% | 32.4% |
| Interquartile Range (IQR) | 27.1% | 9.7% |
| Standard Deviation (Sample) | 26.1% | 12.0% |
| Standard Deviation (Population) | 25.7% | 11.9% |
Demographics Similar to Immigrants from Germany and French Canadians by Disability Age 65 to 74
In terms of disability age 65 to 74, the demographic groups most similar to Immigrants from Germany are Haitian (23.4%, a difference of 0.010%), Immigrants from Eastern Africa (23.4%, a difference of 0.020%), Irish (23.4%, a difference of 0.11%), Basque (23.5%, a difference of 0.25%), and Portuguese (23.5%, a difference of 0.29%). Similarly, the demographic groups most similar to French Canadians are Immigrants from Ecuador (23.7%, a difference of 0.010%), Welsh (23.7%, a difference of 0.030%), Immigrants from Africa (23.7%, a difference of 0.040%), Immigrants from Bahamas (23.7%, a difference of 0.050%), and Immigrants (23.7%, a difference of 0.14%).
| Demographics | Rating | Rank | Disability Age 65 to 74 |
| Irish | 44.4 /100 | #182 | Average 23.4% |
| Immigrants | Eastern Africa | 42.8 /100 | #183 | Average 23.4% |
| Immigrants | Germany | 42.5 /100 | #184 | Average 23.4% |
| Haitians | 42.4 /100 | #185 | Average 23.4% |
| Basques | 38.4 /100 | #186 | Fair 23.5% |
| Portuguese | 37.8 /100 | #187 | Fair 23.5% |
| Immigrants | Cuba | 34.0 /100 | #188 | Fair 23.6% |
| Scottish | 33.1 /100 | #189 | Fair 23.6% |
| Immigrants | Guyana | 31.2 /100 | #190 | Fair 23.6% |
| Immigrants | Bangladesh | 30.2 /100 | #191 | Fair 23.6% |
| Ecuadorians | 29.7 /100 | #192 | Fair 23.6% |
| English | 28.5 /100 | #193 | Fair 23.6% |
| Sudanese | 27.8 /100 | #194 | Fair 23.7% |
| Immigrants | St. Vincent and the Grenadines | 26.1 /100 | #195 | Fair 23.7% |
| Immigrants | Trinidad and Tobago | 26.1 /100 | #196 | Fair 23.7% |
| Immigrants | Immigrants | 25.8 /100 | #197 | Fair 23.7% |
| Immigrants | Africa | 24.4 /100 | #198 | Fair 23.7% |
| Welsh | 24.3 /100 | #199 | Fair 23.7% |
| French Canadians | 24.0 /100 | #200 | Fair 23.7% |
| Immigrants | Ecuador | 23.9 /100 | #201 | Fair 23.7% |
| Immigrants | Bahamas | 23.3 /100 | #202 | Fair 23.7% |