Immigrants from Europe vs Immigrants from Cabo Verde Unemployment Among Ages 45 to 54 years
COMPARE
Immigrants from Europe
Immigrants from Cabo Verde
Unemployment Among Ages 45 to 54 years
Unemployment Among Ages 45 to 54 years Comparison
Immigrants from Europe
Immigrants from Cabo Verde
4.5%
UNEMPLOYMENT AMONG AGES 45 TO 54 YEARS
54.7/ 100
METRIC RATING
168th/ 347
METRIC RANK
5.9%
UNEMPLOYMENT AMONG AGES 45 TO 54 YEARS
0.0/ 100
METRIC RATING
323rd/ 347
METRIC RANK
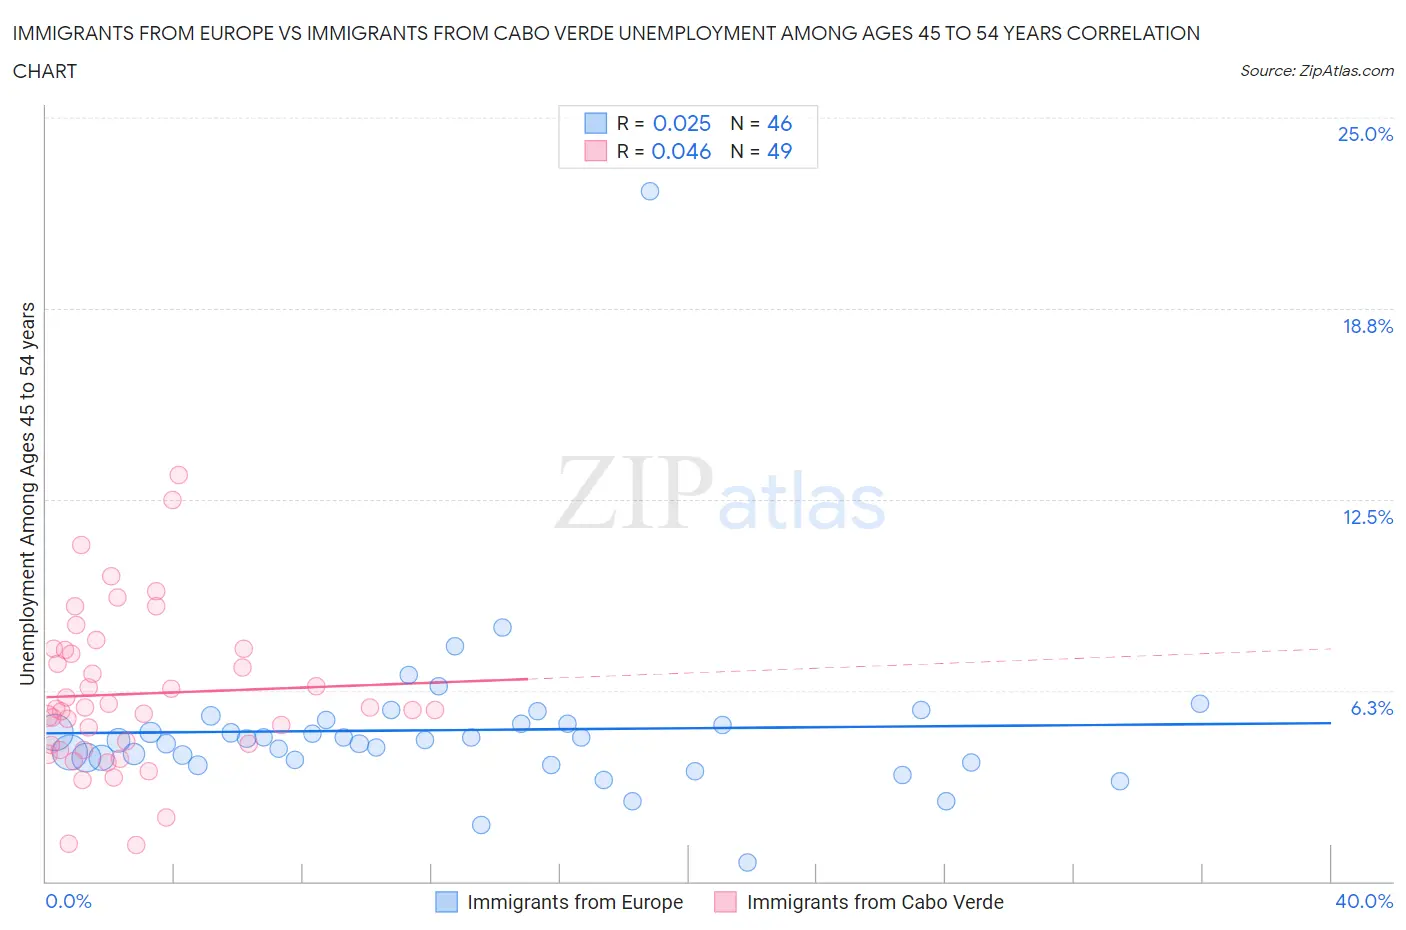
Immigrants from Europe vs Immigrants from Cabo Verde Unemployment Among Ages 45 to 54 years Correlation Chart
The statistical analysis conducted on geographies consisting of 515,197,690 people shows no correlation between the proportion of Immigrants from Europe and unemployment rate among population between the ages 45 and 54 in the United States with a correlation coefficient (R) of 0.025 and weighted average of 4.5%. Similarly, the statistical analysis conducted on geographies consisting of 37,908,460 people shows no correlation between the proportion of Immigrants from Cabo Verde and unemployment rate among population between the ages 45 and 54 in the United States with a correlation coefficient (R) of 0.046 and weighted average of 5.9%, a difference of 31.2%.
Unemployment Among Ages 45 to 54 years Correlation Summary
| Measurement | Immigrants from Europe | Immigrants from Cabo Verde |
| Minimum | 0.60% | 1.2% |
| Maximum | 22.6% | 13.3% |
| Range | 22.0% | 12.1% |
| Mean | 5.0% | 6.1% |
| Median | 4.6% | 5.7% |
| Interquartile 25% (IQ1) | 4.0% | 4.4% |
| Interquartile 75% (IQ3) | 5.2% | 7.6% |
| Interquartile Range (IQR) | 1.2% | 3.2% |
| Standard Deviation (Sample) | 3.0% | 2.6% |
| Standard Deviation (Population) | 2.9% | 2.5% |
Similar Demographics by Unemployment Among Ages 45 to 54 years
Demographics Similar to Immigrants from Europe by Unemployment Among Ages 45 to 54 years
In terms of unemployment among ages 45 to 54 years, the demographic groups most similar to Immigrants from Europe are Immigrants from Egypt (4.5%, a difference of 0.0%), Spaniard (4.5%, a difference of 0.020%), Egyptian (4.5%, a difference of 0.050%), Colombian (4.5%, a difference of 0.070%), and Immigrants from Brazil (4.5%, a difference of 0.080%).
| Demographics | Rating | Rank | Unemployment Among Ages 45 to 54 years |
| Immigrants | Eastern Europe | 61.6 /100 | #161 | Good 4.5% |
| Immigrants | Indonesia | 60.3 /100 | #162 | Good 4.5% |
| Bangladeshis | 59.7 /100 | #163 | Average 4.5% |
| Samoans | 58.5 /100 | #164 | Average 4.5% |
| Maltese | 57.9 /100 | #165 | Average 4.5% |
| Immigrants | Western Europe | 57.4 /100 | #166 | Average 4.5% |
| Immigrants | Brazil | 56.4 /100 | #167 | Average 4.5% |
| Immigrants | Europe | 54.7 /100 | #168 | Average 4.5% |
| Immigrants | Egypt | 54.7 /100 | #169 | Average 4.5% |
| Spaniards | 54.3 /100 | #170 | Average 4.5% |
| Egyptians | 53.6 /100 | #171 | Average 4.5% |
| Colombians | 53.3 /100 | #172 | Average 4.5% |
| Immigrants | Colombia | 52.0 /100 | #173 | Average 4.5% |
| Immigrants | Hungary | 50.0 /100 | #174 | Average 4.5% |
| Immigrants | France | 49.4 /100 | #175 | Average 4.5% |
Demographics Similar to Immigrants from Cabo Verde by Unemployment Among Ages 45 to 54 years
In terms of unemployment among ages 45 to 54 years, the demographic groups most similar to Immigrants from Cabo Verde are Native/Alaskan (6.1%, a difference of 2.3%), Immigrants from the Azores (5.7%, a difference of 3.0%), Yakama (5.7%, a difference of 3.5%), Immigrants from Armenia (6.1%, a difference of 3.7%), and Immigrants from St. Vincent and the Grenadines (5.7%, a difference of 3.8%).
| Demographics | Rating | Rank | Unemployment Among Ages 45 to 54 years |
| Immigrants | Guyana | 0.0 /100 | #316 | Tragic 5.6% |
| Houma | 0.0 /100 | #317 | Tragic 5.6% |
| British West Indians | 0.0 /100 | #318 | Tragic 5.7% |
| Cape Verdeans | 0.0 /100 | #319 | Tragic 5.7% |
| Immigrants | St. Vincent and the Grenadines | 0.0 /100 | #320 | Tragic 5.7% |
| Yakama | 0.0 /100 | #321 | Tragic 5.7% |
| Immigrants | Azores | 0.0 /100 | #322 | Tragic 5.7% |
| Immigrants | Cabo Verde | 0.0 /100 | #323 | Tragic 5.9% |
| Natives/Alaskans | 0.0 /100 | #324 | Tragic 6.1% |
| Immigrants | Armenia | 0.0 /100 | #325 | Tragic 6.1% |
| Ute | 0.0 /100 | #326 | Tragic 6.2% |
| Dominicans | 0.0 /100 | #327 | Tragic 6.2% |
| Pueblo | 0.0 /100 | #328 | Tragic 6.2% |
| Alaska Natives | 0.0 /100 | #329 | Tragic 6.3% |
| Immigrants | Dominican Republic | 0.0 /100 | #330 | Tragic 6.3% |