Immigrants from Belize vs Immigrants from Cabo Verde Unemployment Among Ages 45 to 54 years
COMPARE
Immigrants from Belize
Immigrants from Cabo Verde
Unemployment Among Ages 45 to 54 years
Unemployment Among Ages 45 to 54 years Comparison
Immigrants from Belize
Immigrants from Cabo Verde
5.3%
UNEMPLOYMENT AMONG AGES 45 TO 54 YEARS
0.0/ 100
METRIC RATING
303rd/ 347
METRIC RANK
5.9%
UNEMPLOYMENT AMONG AGES 45 TO 54 YEARS
0.0/ 100
METRIC RATING
323rd/ 347
METRIC RANK
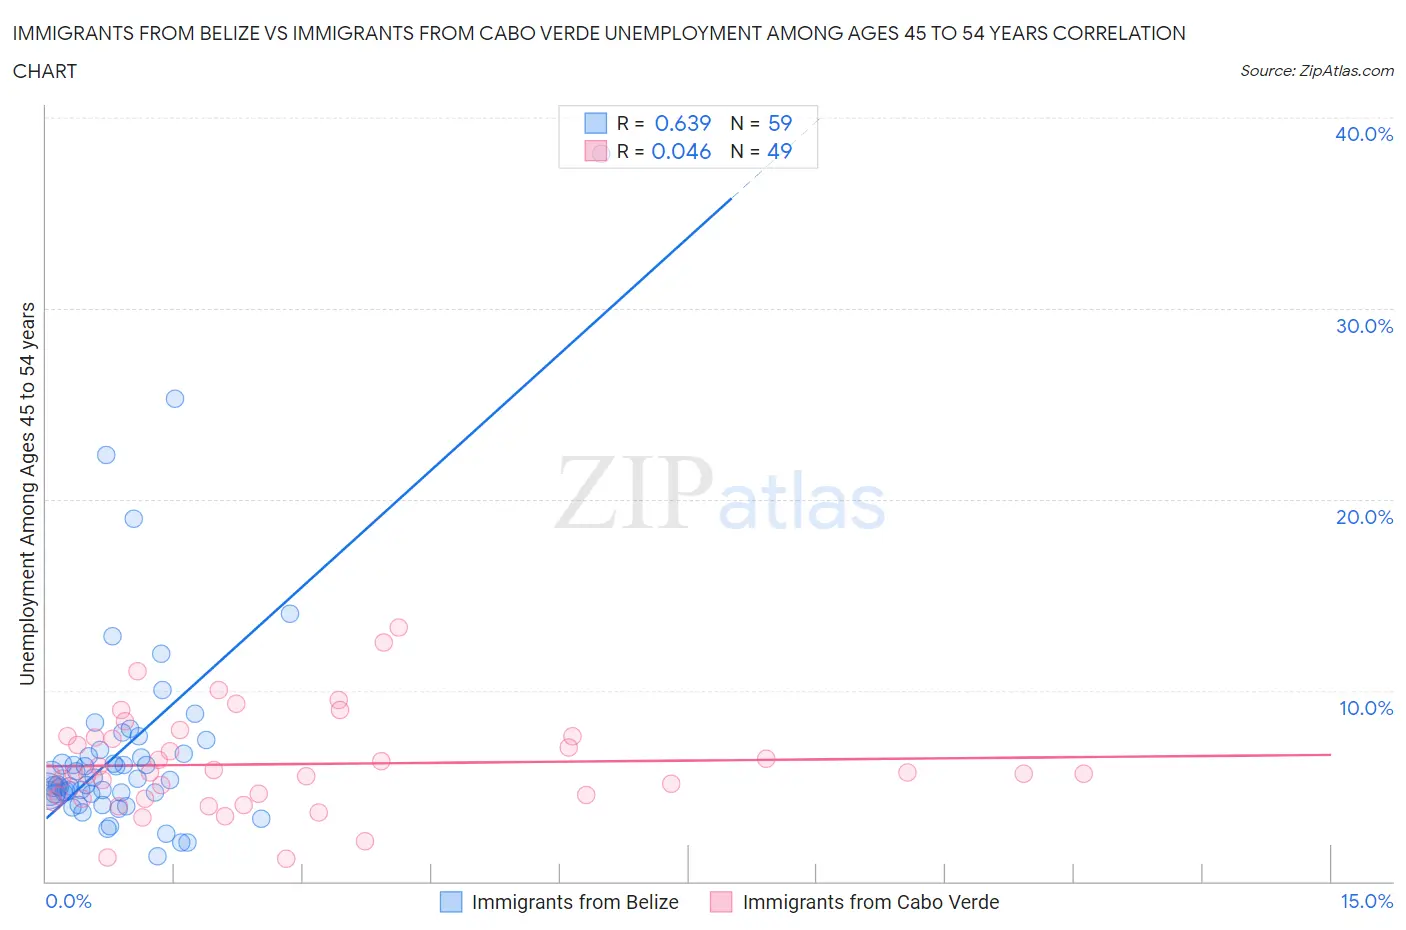
Immigrants from Belize vs Immigrants from Cabo Verde Unemployment Among Ages 45 to 54 years Correlation Chart
The statistical analysis conducted on geographies consisting of 129,652,080 people shows a significant positive correlation between the proportion of Immigrants from Belize and unemployment rate among population between the ages 45 and 54 in the United States with a correlation coefficient (R) of 0.639 and weighted average of 5.3%. Similarly, the statistical analysis conducted on geographies consisting of 37,908,460 people shows no correlation between the proportion of Immigrants from Cabo Verde and unemployment rate among population between the ages 45 and 54 in the United States with a correlation coefficient (R) of 0.046 and weighted average of 5.9%, a difference of 10.8%.
Unemployment Among Ages 45 to 54 years Correlation Summary
| Measurement | Immigrants from Belize | Immigrants from Cabo Verde |
| Minimum | 1.3% | 1.2% |
| Maximum | 38.1% | 13.3% |
| Range | 36.8% | 12.1% |
| Mean | 7.0% | 6.1% |
| Median | 5.3% | 5.7% |
| Interquartile 25% (IQ1) | 4.6% | 4.4% |
| Interquartile 75% (IQ3) | 6.9% | 7.6% |
| Interquartile Range (IQR) | 2.3% | 3.2% |
| Standard Deviation (Sample) | 6.0% | 2.6% |
| Standard Deviation (Population) | 6.0% | 2.5% |
Demographics Similar to Immigrants from Belize and Immigrants from Cabo Verde by Unemployment Among Ages 45 to 54 years
In terms of unemployment among ages 45 to 54 years, the demographic groups most similar to Immigrants from Belize are Immigrants from Jamaica (5.4%, a difference of 0.18%), Immigrants from West Indies (5.4%, a difference of 0.35%), Immigrants from Bangladesh (5.4%, a difference of 0.51%), Vietnamese (5.4%, a difference of 0.77%), and Black/African American (5.4%, a difference of 1.5%). Similarly, the demographic groups most similar to Immigrants from Cabo Verde are Immigrants from the Azores (5.7%, a difference of 3.0%), Yakama (5.7%, a difference of 3.5%), Immigrants from St. Vincent and the Grenadines (5.7%, a difference of 3.8%), Cape Verdean (5.7%, a difference of 3.9%), and British West Indian (5.7%, a difference of 4.4%).
| Demographics | Rating | Rank | Unemployment Among Ages 45 to 54 years |
| Immigrants | Belize | 0.0 /100 | #303 | Tragic 5.3% |
| Immigrants | Jamaica | 0.0 /100 | #304 | Tragic 5.4% |
| Immigrants | West Indies | 0.0 /100 | #305 | Tragic 5.4% |
| Immigrants | Bangladesh | 0.0 /100 | #306 | Tragic 5.4% |
| Vietnamese | 0.0 /100 | #307 | Tragic 5.4% |
| Blacks/African Americans | 0.0 /100 | #308 | Tragic 5.4% |
| Barbadians | 0.0 /100 | #309 | Tragic 5.5% |
| Immigrants | Barbados | 0.0 /100 | #310 | Tragic 5.5% |
| Chippewa | 0.0 /100 | #311 | Tragic 5.5% |
| Immigrants | Grenada | 0.0 /100 | #312 | Tragic 5.6% |
| Shoshone | 0.0 /100 | #313 | Tragic 5.6% |
| Guyanese | 0.0 /100 | #314 | Tragic 5.6% |
| Immigrants | Dominica | 0.0 /100 | #315 | Tragic 5.6% |
| Immigrants | Guyana | 0.0 /100 | #316 | Tragic 5.6% |
| Houma | 0.0 /100 | #317 | Tragic 5.6% |
| British West Indians | 0.0 /100 | #318 | Tragic 5.7% |
| Cape Verdeans | 0.0 /100 | #319 | Tragic 5.7% |
| Immigrants | St. Vincent and the Grenadines | 0.0 /100 | #320 | Tragic 5.7% |
| Yakama | 0.0 /100 | #321 | Tragic 5.7% |
| Immigrants | Azores | 0.0 /100 | #322 | Tragic 5.7% |
| Immigrants | Cabo Verde | 0.0 /100 | #323 | Tragic 5.9% |