Immigrants from India vs Immigrants from Argentina Unemployment Among Ages 45 to 54 years
COMPARE
Immigrants from India
Immigrants from Argentina
Unemployment Among Ages 45 to 54 years
Unemployment Among Ages 45 to 54 years Comparison
Immigrants from India
Immigrants from Argentina
3.9%
UNEMPLOYMENT AMONG AGES 45 TO 54 YEARS
100.0/ 100
METRIC RATING
4th/ 347
METRIC RANK
4.3%
UNEMPLOYMENT AMONG AGES 45 TO 54 YEARS
96.9/ 100
METRIC RATING
89th/ 347
METRIC RANK
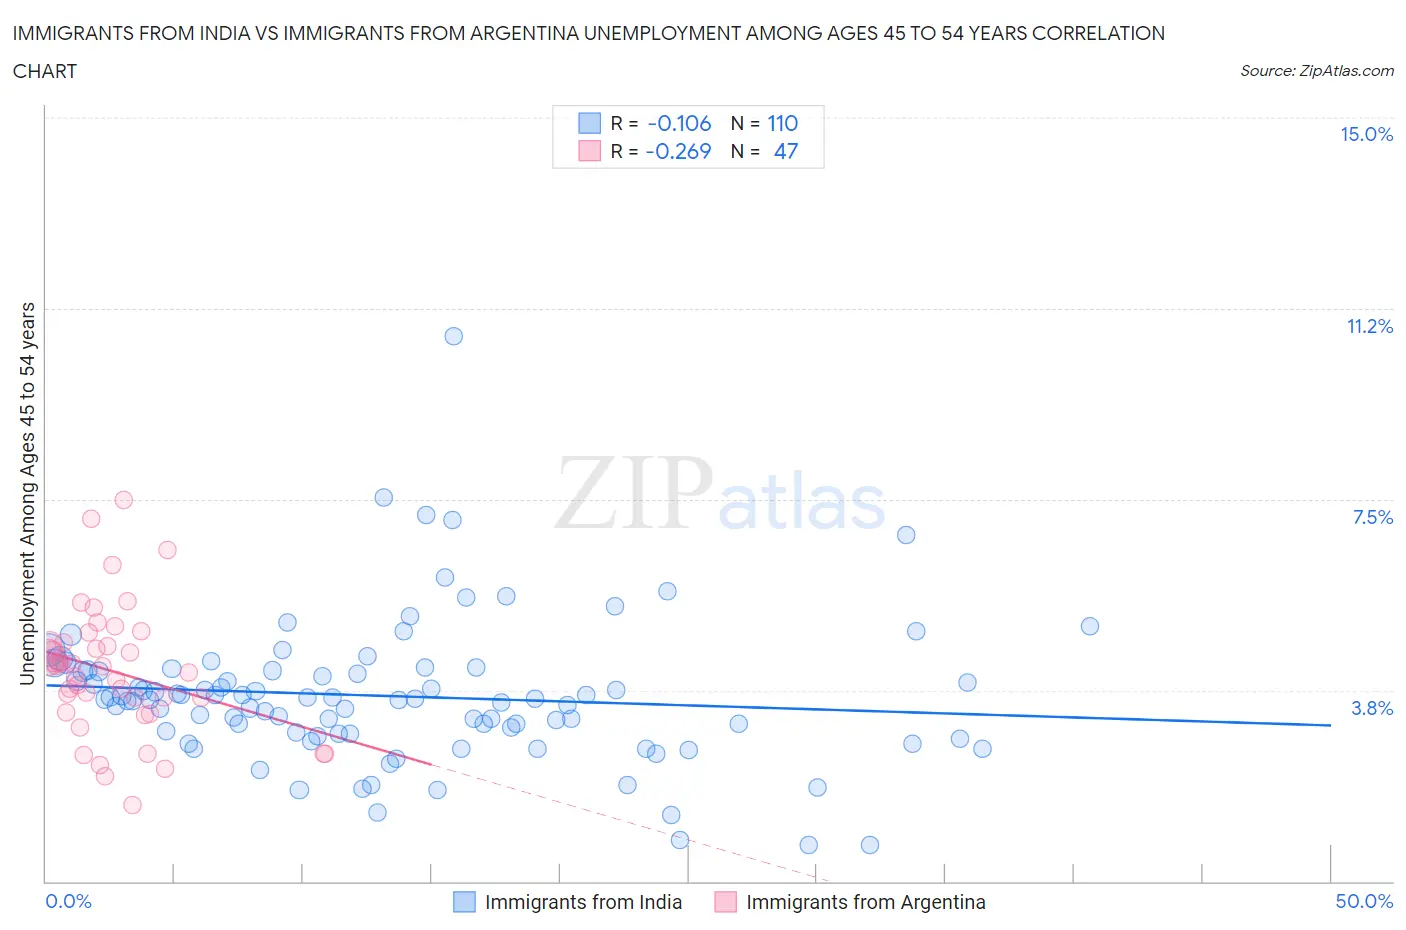
Immigrants from India vs Immigrants from Argentina Unemployment Among Ages 45 to 54 years Correlation Chart
The statistical analysis conducted on geographies consisting of 421,870,941 people shows a poor negative correlation between the proportion of Immigrants from India and unemployment rate among population between the ages 45 and 54 in the United States with a correlation coefficient (R) of -0.106 and weighted average of 3.9%. Similarly, the statistical analysis conducted on geographies consisting of 261,592,376 people shows a weak negative correlation between the proportion of Immigrants from Argentina and unemployment rate among population between the ages 45 and 54 in the United States with a correlation coefficient (R) of -0.269 and weighted average of 4.3%, a difference of 11.7%.
Unemployment Among Ages 45 to 54 years Correlation Summary
| Measurement | Immigrants from India | Immigrants from Argentina |
| Minimum | 0.70% | 1.5% |
| Maximum | 10.7% | 7.5% |
| Range | 10.0% | 6.0% |
| Mean | 3.6% | 4.1% |
| Median | 3.6% | 4.2% |
| Interquartile 25% (IQ1) | 2.9% | 3.3% |
| Interquartile 75% (IQ3) | 4.1% | 4.7% |
| Interquartile Range (IQR) | 1.2% | 1.4% |
| Standard Deviation (Sample) | 1.4% | 1.3% |
| Standard Deviation (Population) | 1.4% | 1.3% |
Similar Demographics by Unemployment Among Ages 45 to 54 years
Demographics Similar to Immigrants from India by Unemployment Among Ages 45 to 54 years
In terms of unemployment among ages 45 to 54 years, the demographic groups most similar to Immigrants from India are Danish (3.9%, a difference of 0.17%), Immigrants from Cuba (3.9%, a difference of 0.39%), Norwegian (3.9%, a difference of 0.87%), Immigrants from Venezuela (3.9%, a difference of 1.6%), and Chinese (4.0%, a difference of 2.0%).
| Demographics | Rating | Rank | Unemployment Among Ages 45 to 54 years |
| Hmong | 100.0 /100 | #1 | Exceptional 3.7% |
| Fijians | 100.0 /100 | #2 | Exceptional 3.8% |
| Norwegians | 100.0 /100 | #3 | Exceptional 3.9% |
| Immigrants | India | 100.0 /100 | #4 | Exceptional 3.9% |
| Danes | 100.0 /100 | #5 | Exceptional 3.9% |
| Immigrants | Cuba | 100.0 /100 | #6 | Exceptional 3.9% |
| Immigrants | Venezuela | 100.0 /100 | #7 | Exceptional 3.9% |
| Chinese | 100.0 /100 | #8 | Exceptional 4.0% |
| Czechs | 100.0 /100 | #9 | Exceptional 4.0% |
| Venezuelans | 100.0 /100 | #10 | Exceptional 4.0% |
| Scandinavians | 100.0 /100 | #11 | Exceptional 4.0% |
| Swedes | 100.0 /100 | #12 | Exceptional 4.0% |
| Cubans | 100.0 /100 | #13 | Exceptional 4.0% |
| Immigrants | Bosnia and Herzegovina | 100.0 /100 | #14 | Exceptional 4.0% |
| Immigrants | Bolivia | 100.0 /100 | #15 | Exceptional 4.0% |
Demographics Similar to Immigrants from Argentina by Unemployment Among Ages 45 to 54 years
In terms of unemployment among ages 45 to 54 years, the demographic groups most similar to Immigrants from Argentina are Immigrants from Turkey (4.3%, a difference of 0.0%), Sudanese (4.3%, a difference of 0.040%), Asian (4.3%, a difference of 0.050%), Ukrainian (4.3%, a difference of 0.12%), and Ethiopian (4.3%, a difference of 0.13%).
| Demographics | Rating | Rank | Unemployment Among Ages 45 to 54 years |
| Eastern Europeans | 97.6 /100 | #82 | Exceptional 4.3% |
| Australians | 97.4 /100 | #83 | Exceptional 4.3% |
| Italians | 97.3 /100 | #84 | Exceptional 4.3% |
| French | 97.3 /100 | #85 | Exceptional 4.3% |
| Ethiopians | 97.2 /100 | #86 | Exceptional 4.3% |
| Sudanese | 97.0 /100 | #87 | Exceptional 4.3% |
| Immigrants | Turkey | 96.9 /100 | #88 | Exceptional 4.3% |
| Immigrants | Argentina | 96.9 /100 | #89 | Exceptional 4.3% |
| Asians | 96.8 /100 | #90 | Exceptional 4.3% |
| Ukrainians | 96.6 /100 | #91 | Exceptional 4.3% |
| Mongolians | 96.6 /100 | #92 | Exceptional 4.3% |
| Argentineans | 96.5 /100 | #93 | Exceptional 4.3% |
| Immigrants | Malaysia | 96.2 /100 | #94 | Exceptional 4.4% |
| Immigrants | Ethiopia | 96.1 /100 | #95 | Exceptional 4.4% |
| Indonesians | 95.4 /100 | #96 | Exceptional 4.4% |