Immigrants from England vs Immigrants from Latvia Unemployment Among Ages 65 to 74 years
COMPARE
Immigrants from England
Immigrants from Latvia
Unemployment Among Ages 65 to 74 years
Unemployment Among Ages 65 to 74 years Comparison
Immigrants from England
Immigrants from Latvia
5.3%
UNEMPLOYMENT AMONG AGES 65 TO 74 YEARS
86.2/ 100
METRIC RATING
129th/ 347
METRIC RANK
5.3%
UNEMPLOYMENT AMONG AGES 65 TO 74 YEARS
74.6/ 100
METRIC RATING
147th/ 347
METRIC RANK
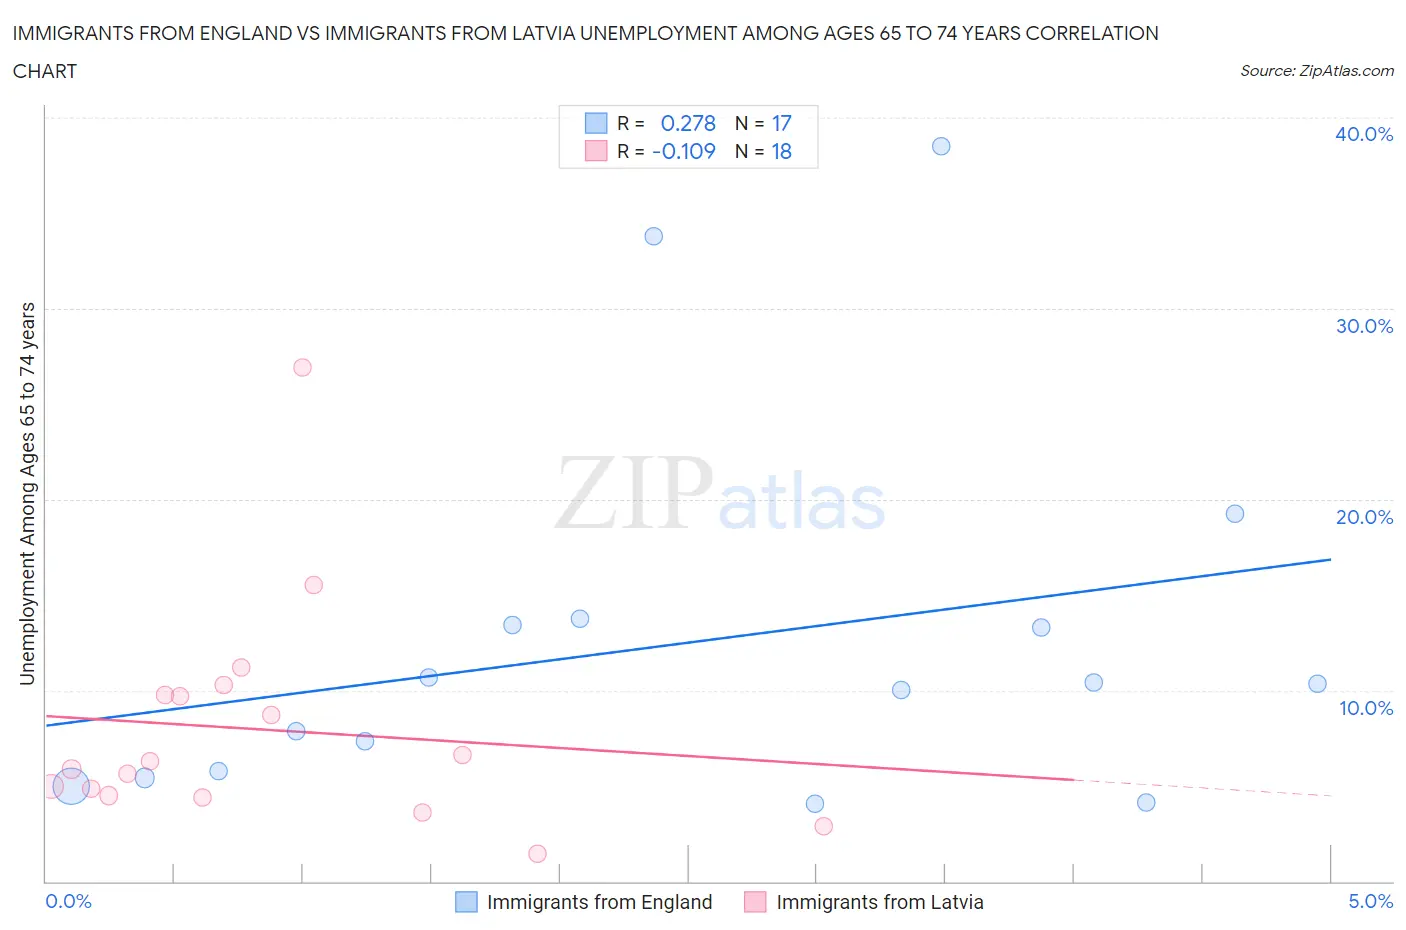
Immigrants from England vs Immigrants from Latvia Unemployment Among Ages 65 to 74 years Correlation Chart
The statistical analysis conducted on geographies consisting of 344,296,821 people shows a weak positive correlation between the proportion of Immigrants from England and unemployment rate among population between the ages 65 and 74 in the United States with a correlation coefficient (R) of 0.278 and weighted average of 5.3%. Similarly, the statistical analysis conducted on geographies consisting of 108,700,333 people shows a poor negative correlation between the proportion of Immigrants from Latvia and unemployment rate among population between the ages 65 and 74 in the United States with a correlation coefficient (R) of -0.109 and weighted average of 5.3%, a difference of 0.64%.
Unemployment Among Ages 65 to 74 years Correlation Summary
| Measurement | Immigrants from England | Immigrants from Latvia |
| Minimum | 4.1% | 1.5% |
| Maximum | 38.5% | 26.9% |
| Range | 34.4% | 25.4% |
| Mean | 12.5% | 7.9% |
| Median | 10.3% | 6.1% |
| Interquartile 25% (IQ1) | 5.6% | 4.5% |
| Interquartile 75% (IQ3) | 13.6% | 9.8% |
| Interquartile Range (IQR) | 8.0% | 5.3% |
| Standard Deviation (Sample) | 9.8% | 5.9% |
| Standard Deviation (Population) | 9.5% | 5.7% |
Demographics Similar to Immigrants from England and Immigrants from Latvia by Unemployment Among Ages 65 to 74 years
In terms of unemployment among ages 65 to 74 years, the demographic groups most similar to Immigrants from England are Immigrants from Hong Kong (5.3%, a difference of 0.030%), Eastern European (5.3%, a difference of 0.040%), Immigrants from Russia (5.3%, a difference of 0.21%), Korean (5.3%, a difference of 0.23%), and Ukrainian (5.3%, a difference of 0.26%). Similarly, the demographic groups most similar to Immigrants from Latvia are Irish (5.3%, a difference of 0.010%), Canadian (5.3%, a difference of 0.020%), Immigrants from Sri Lanka (5.3%, a difference of 0.040%), Turkish (5.3%, a difference of 0.070%), and New Zealander (5.3%, a difference of 0.070%).
| Demographics | Rating | Rank | Unemployment Among Ages 65 to 74 years |
| Immigrants | Hong Kong | 86.5 /100 | #128 | Excellent 5.3% |
| Immigrants | England | 86.2 /100 | #129 | Excellent 5.3% |
| Eastern Europeans | 85.6 /100 | #130 | Excellent 5.3% |
| Immigrants | Russia | 83.0 /100 | #131 | Excellent 5.3% |
| Koreans | 82.6 /100 | #132 | Excellent 5.3% |
| Ukrainians | 82.0 /100 | #133 | Excellent 5.3% |
| Immigrants | Panama | 81.8 /100 | #134 | Excellent 5.3% |
| Immigrants | Serbia | 81.8 /100 | #135 | Excellent 5.3% |
| Celtics | 80.8 /100 | #136 | Excellent 5.3% |
| Immigrants | Afghanistan | 80.8 /100 | #137 | Excellent 5.3% |
| Chileans | 79.7 /100 | #138 | Good 5.3% |
| Finns | 79.0 /100 | #139 | Good 5.3% |
| Immigrants | Laos | 78.6 /100 | #140 | Good 5.3% |
| Immigrants | Asia | 78.4 /100 | #141 | Good 5.3% |
| Turks | 76.2 /100 | #142 | Good 5.3% |
| New Zealanders | 76.1 /100 | #143 | Good 5.3% |
| Immigrants | Chile | 76.0 /100 | #144 | Good 5.3% |
| Canadians | 75.0 /100 | #145 | Good 5.3% |
| Irish | 74.8 /100 | #146 | Good 5.3% |
| Immigrants | Latvia | 74.6 /100 | #147 | Good 5.3% |
| Immigrants | Sri Lanka | 73.8 /100 | #148 | Good 5.3% |