Immigrants from El Salvador vs Guyanese Unemployment Among Youth under 25 years
COMPARE
Immigrants from El Salvador
Guyanese
Unemployment Among Youth under 25 years
Unemployment Among Youth under 25 years Comparison
Immigrants from El Salvador
Guyanese
12.4%
UNEMPLOYMENT AMONG YOUTH UNDER 25 YEARS
0.1/ 100
METRIC RATING
261st/ 347
METRIC RANK
15.9%
UNEMPLOYMENT AMONG YOUTH UNDER 25 YEARS
0.0/ 100
METRIC RATING
333rd/ 347
METRIC RANK
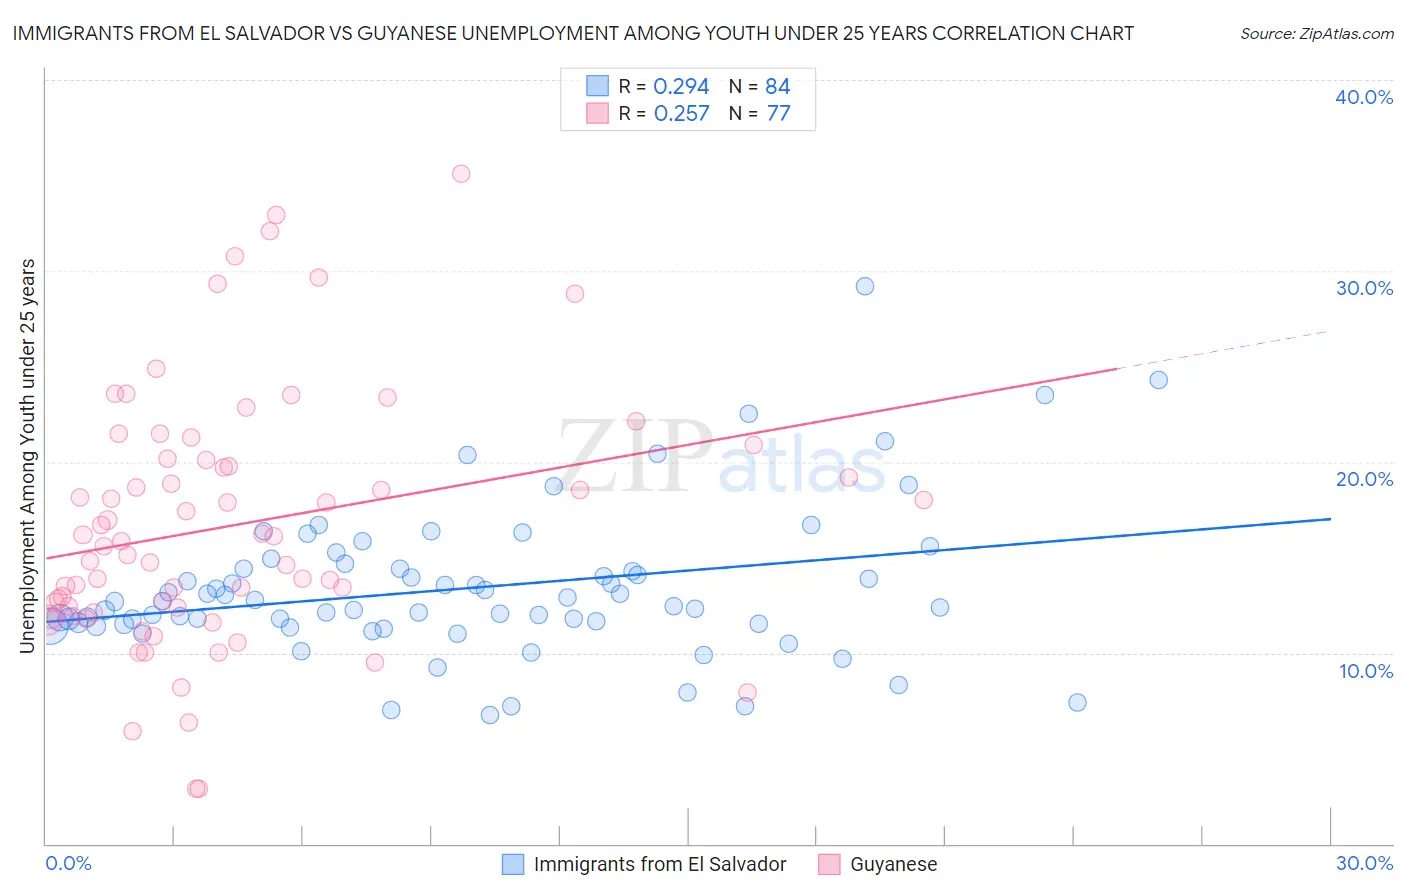
Immigrants from El Salvador vs Guyanese Unemployment Among Youth under 25 years Correlation Chart
The statistical analysis conducted on geographies consisting of 354,363,061 people shows a weak positive correlation between the proportion of Immigrants from El Salvador and unemployment rate among youth under the age of 25 in the United States with a correlation coefficient (R) of 0.294 and weighted average of 12.4%. Similarly, the statistical analysis conducted on geographies consisting of 176,229,123 people shows a weak positive correlation between the proportion of Guyanese and unemployment rate among youth under the age of 25 in the United States with a correlation coefficient (R) of 0.257 and weighted average of 15.9%, a difference of 27.9%.
Unemployment Among Youth under 25 years Correlation Summary
| Measurement | Immigrants from El Salvador | Guyanese |
| Minimum | 6.7% | 2.9% |
| Maximum | 29.2% | 35.1% |
| Range | 22.4% | 32.2% |
| Mean | 13.4% | 16.7% |
| Median | 12.6% | 15.9% |
| Interquartile 25% (IQ1) | 11.5% | 12.3% |
| Interquartile 75% (IQ3) | 14.4% | 20.2% |
| Interquartile Range (IQR) | 2.9% | 7.9% |
| Standard Deviation (Sample) | 3.9% | 6.7% |
| Standard Deviation (Population) | 3.9% | 6.6% |
Similar Demographics by Unemployment Among Youth under 25 years
Demographics Similar to Immigrants from El Salvador by Unemployment Among Youth under 25 years
In terms of unemployment among youth under 25 years, the demographic groups most similar to Immigrants from El Salvador are Immigrants from Panama (12.4%, a difference of 0.010%), Immigrants from Mexico (12.4%, a difference of 0.050%), Cree (12.4%, a difference of 0.14%), Immigrants from Central America (12.4%, a difference of 0.31%), and Salvadoran (12.4%, a difference of 0.37%).
| Demographics | Rating | Rank | Unemployment Among Youth under 25 years |
| Hondurans | 0.3 /100 | #254 | Tragic 12.3% |
| Hispanics or Latinos | 0.2 /100 | #255 | Tragic 12.4% |
| Liberians | 0.2 /100 | #256 | Tragic 12.4% |
| Panamanians | 0.2 /100 | #257 | Tragic 12.4% |
| Salvadorans | 0.1 /100 | #258 | Tragic 12.4% |
| Immigrants | Central America | 0.1 /100 | #259 | Tragic 12.4% |
| Immigrants | Panama | 0.1 /100 | #260 | Tragic 12.4% |
| Immigrants | El Salvador | 0.1 /100 | #261 | Tragic 12.4% |
| Immigrants | Mexico | 0.1 /100 | #262 | Tragic 12.4% |
| Cree | 0.1 /100 | #263 | Tragic 12.4% |
| Puget Sound Salish | 0.1 /100 | #264 | Tragic 12.5% |
| Nepalese | 0.0 /100 | #265 | Tragic 12.5% |
| Immigrants | Latin America | 0.0 /100 | #266 | Tragic 12.6% |
| Sub-Saharan Africans | 0.0 /100 | #267 | Tragic 12.6% |
| Tlingit-Haida | 0.0 /100 | #268 | Tragic 12.7% |
Demographics Similar to Guyanese by Unemployment Among Youth under 25 years
In terms of unemployment among youth under 25 years, the demographic groups most similar to Guyanese are Immigrants from Guyana (15.9%, a difference of 0.25%), Immigrants from Grenada (15.8%, a difference of 0.46%), Dominican (15.7%, a difference of 1.1%), Immigrants from St. Vincent and the Grenadines (16.1%, a difference of 1.6%), and Yakama (15.6%, a difference of 2.0%).
| Demographics | Rating | Rank | Unemployment Among Youth under 25 years |
| Immigrants | Barbados | 0.0 /100 | #326 | Tragic 15.2% |
| British West Indians | 0.0 /100 | #327 | Tragic 15.5% |
| Immigrants | Dominican Republic | 0.0 /100 | #328 | Tragic 15.6% |
| Immigrants | Yemen | 0.0 /100 | #329 | Tragic 15.6% |
| Yakama | 0.0 /100 | #330 | Tragic 15.6% |
| Dominicans | 0.0 /100 | #331 | Tragic 15.7% |
| Immigrants | Grenada | 0.0 /100 | #332 | Tragic 15.8% |
| Guyanese | 0.0 /100 | #333 | Tragic 15.9% |
| Immigrants | Guyana | 0.0 /100 | #334 | Tragic 15.9% |
| Immigrants | St. Vincent and the Grenadines | 0.0 /100 | #335 | Tragic 16.1% |
| Pima | 0.0 /100 | #336 | Tragic 16.2% |
| Arapaho | 0.0 /100 | #337 | Tragic 16.3% |
| Yuman | 0.0 /100 | #338 | Tragic 16.3% |
| Tsimshian | 0.0 /100 | #339 | Tragic 16.5% |
| Colville | 0.0 /100 | #340 | Tragic 16.8% |