Immigrants from Croatia vs Guyanese Unemployment Among Youth under 25 years

COMPARE

Immigrants from Croatia
Race
Ancestry
AfghanAfricanAlaska NativeAlaskan AthabascanAlbanianAleutAlsatianAmericanApacheArabArapahoArgentineanArmenianAssyrian/Chaldean/SyriacAustralianAustrianBahamianBangladeshiBarbadianBasqueBelgianBelizeanBermudanBhutaneseBlackfeetBolivianBrazilianBritishBritish West IndianBulgarianBurmeseCajunCambodianCanadianCape VerdeanCarpatho RusynCelticCentral AmericanCentral American IndianCherokeeCheyenneChickasawChileanChineseChippewaChoctawColombianColvilleComancheCosta RicanCreeCreekCroatianCrowCubanCypriotCzechCzechoslovakianDanishDelawareDominicanDutchDutch West IndianEastern EuropeanEcuadorianEgyptianEnglishEstonianEthiopianEuropeanFijianFilipinoFinnishFrenchFrench American IndianFrench CanadianGermanGerman RussianGhanaianGreekGuamanian/ChamorroGuatemalanHaitianHmongHonduranHopiHoumaHungarianIcelanderIndian (Asian)IndonesianInupiatIranianIraqiIrishIroquoisIsraeliItalianJamaicanJapaneseJordanianKenyanKiowaKoreanLaotianLatvianLebaneseLiberianLithuanianLumbeeLuxembourgerMacedonianMalaysianMalteseMarshalleseMenomineeMexicanMexican American IndianMongolianMoroccanNative HawaiianNavajoNepaleseNew ZealanderNicaraguanNigerianNorthern EuropeanNorwegianOkinawanOsageOttawaPaiutePakistaniPalestinianPanamanianParaguayanPennsylvania GermanPeruvianPimaPolishPortuguesePotawatomiPuebloPuerto RicanPuget Sound SalishRomanianRussianSalvadoranSamoanScandinavianScotch-IrishScottishSeminoleSenegaleseSerbianShoshoneSierra LeoneanSiouxSlavicSlovakSloveneSomaliSouth AfricanSouth AmericanSouth American IndianSoviet UnionSpaniardSpanishSpanish AmericanSpanish American IndianSri LankanSubsaharan AfricanSudaneseSwedishSwissSyrianTaiwaneseThaiTlingit-HaidaTohono O'OdhamTonganTrinidadian and TobagonianTsimshianTurkishU.S. Virgin IslanderUgandanUkrainianUruguayanUteVenezuelanVietnameseWelshWest IndianYakamaYaquiYugoslavianYumanYup'ikZimbabwean
Immigration
NonimmigrantsImmigrantsAfghanistanAfricaAlbaniaArgentinaArmeniaAsiaAustraliaAustriaBahamasBangladeshBarbadosBelarusBelgiumBelizeBoliviaBosnia and HerzegovinaBrazilBulgariaBurma/MyanmarCabo VerdeCambodiaCameroonCanadaCaribbeanCentral AmericaChileChinaColombiaCongoCosta RicaCroatiaCubaCzechoslovakiaDenmarkDominicaDominican RepublicEastern AfricaEastern AsiaEastern EuropeEcuadorEgyptEl SalvadorEnglandEritreaEthiopiaEuropeFijiFranceGermanyGhanaGreeceGrenadaGuatemalaGuyanaHaitiHondurasHong KongHungaryIndiaIndonesiaIranIraqIrelandIsraelItalyJamaicaJapanJordanKazakhstanKenyaKoreaKuwaitLaosLatin AmericaLatviaLebanonLiberiaLithuaniaMalaysiaMexicoMicronesiaMiddle AfricaMoldovaMoroccoNepalNetherlandsNicaraguaNigeriaNorth AmericaNorth MacedoniaNorthern AfricaNorthern EuropeNorwayOceaniaPakistanPanamaPeruPhilippinesPolandPortugalRomaniaRussiaSaudi ArabiaScotlandSenegalSerbiaSierra LeoneSingaporeSomaliaSouth AfricaSouth AmericaSouth Central AsiaSouth Eastern AsiaSouthern EuropeSpainSri LankaSt. Vincent and the GrenadinesSudanSwedenSwitzerlandSyriaTaiwanThailandTrinidad and TobagoTurkeyUgandaUkraineUruguayUzbekistanVenezuelaVietnamWest IndiesWestern AfricaWestern AsiaWestern EuropeYemenZaireZimbabweAzores
Guyanese
Race
Ancestry
AfghanAfricanAlaska NativeAlaskan AthabascanAlbanianAleutAlsatianAmericanApacheArabArapahoArgentineanArmenianAssyrian/Chaldean/SyriacAustralianAustrianBahamianBangladeshiBarbadianBasqueBelgianBelizeanBermudanBhutaneseBlackfeetBolivianBrazilianBritishBritish West IndianBulgarianBurmeseCajunCambodianCanadianCape VerdeanCarpatho RusynCelticCentral AmericanCentral American IndianCherokeeCheyenneChickasawChileanChineseChippewaChoctawColombianColvilleComancheCosta RicanCreeCreekCroatianCrowCubanCypriotCzechCzechoslovakianDanishDelawareDominicanDutchDutch West IndianEastern EuropeanEcuadorianEgyptianEnglishEstonianEthiopianEuropeanFijianFilipinoFinnishFrenchFrench American IndianFrench CanadianGermanGerman RussianGhanaianGreekGuamanian/ChamorroGuatemalanGuyaneseHaitianHmongHonduranHopiHoumaHungarianIcelanderIndian (Asian)IndonesianInupiatIranianIraqiIrishIroquoisIsraeliItalianJamaicanJapaneseJordanianKenyanKiowaKoreanLaotianLatvianLebaneseLiberianLithuanianLumbeeLuxembourgerMacedonianMalaysianMalteseMarshalleseMenomineeMexicanMexican American IndianMongolianMoroccanNative HawaiianNavajoNepaleseNew ZealanderNicaraguanNigerianNorthern EuropeanNorwegianOkinawanOsageOttawaPaiutePakistaniPalestinianPanamanianParaguayanPennsylvania GermanPeruvianPimaPolishPortuguesePotawatomiPuebloPuerto RicanPuget Sound SalishRomanianRussianSalvadoranSamoanScandinavianScotch-IrishScottishSeminoleSenegaleseSerbianShoshoneSierra LeoneanSiouxSlavicSlovakSloveneSomaliSouth AfricanSouth AmericanSouth American IndianSoviet UnionSpaniardSpanishSpanish AmericanSpanish American IndianSri LankanSubsaharan AfricanSudaneseSwedishSwissSyrianTaiwaneseThaiTlingit-HaidaTohono O'OdhamTonganTrinidadian and TobagonianTsimshianTurkishU.S. Virgin IslanderUgandanUkrainianUruguayanUteVenezuelanVietnameseWelshWest IndianYakamaYaquiYugoslavianYumanYup'ikZimbabwean
Immigration
NonimmigrantsImmigrantsAfghanistanAfricaAlbaniaArgentinaArmeniaAsiaAustraliaAustriaBahamasBangladeshBarbadosBelarusBelgiumBelizeBoliviaBosnia and HerzegovinaBrazilBulgariaBurma/MyanmarCabo VerdeCambodiaCameroonCanadaCaribbeanCentral AmericaChileChinaColombiaCongoCosta RicaCubaCzechoslovakiaDenmarkDominicaDominican RepublicEastern AfricaEastern AsiaEastern EuropeEcuadorEgyptEl SalvadorEnglandEritreaEthiopiaEuropeFijiFranceGermanyGhanaGreeceGrenadaGuatemalaGuyanaHaitiHondurasHong KongHungaryIndiaIndonesiaIranIraqIrelandIsraelItalyJamaicaJapanJordanKazakhstanKenyaKoreaKuwaitLaosLatin AmericaLatviaLebanonLiberiaLithuaniaMalaysiaMexicoMicronesiaMiddle AfricaMoldovaMoroccoNepalNetherlandsNicaraguaNigeriaNorth AmericaNorth MacedoniaNorthern AfricaNorthern EuropeNorwayOceaniaPakistanPanamaPeruPhilippinesPolandPortugalRomaniaRussiaSaudi ArabiaScotlandSenegalSerbiaSierra LeoneSingaporeSomaliaSouth AfricaSouth AmericaSouth Central AsiaSouth Eastern AsiaSouthern EuropeSpainSri LankaSt. Vincent and the GrenadinesSudanSwedenSwitzerlandSyriaTaiwanThailandTrinidad and TobagoTurkeyUgandaUkraineUruguayUzbekistanVenezuelaVietnamWest IndiesWestern AfricaWestern AsiaWestern EuropeYemenZaireZimbabweAzores
Unemployment Among Youth under 25 years
Income
Poverty
Unemployment
Labor Participation
Family Structure
Vehicle Availability
Education Level
Disability

Unemployment Among Youth under 25 years Comparison

Immigrants from Croatia

Guyanese

Exceptional
Tragic
11.1%
UNEMPLOYMENT AMONG YOUTH UNDER 25 YEARS
98.1/ 100
METRIC RATING
63rd/ 347
METRIC RANK
15.9%
UNEMPLOYMENT AMONG YOUTH UNDER 25 YEARS
0.0/ 100
METRIC RATING
333rd/ 347
METRIC RANK

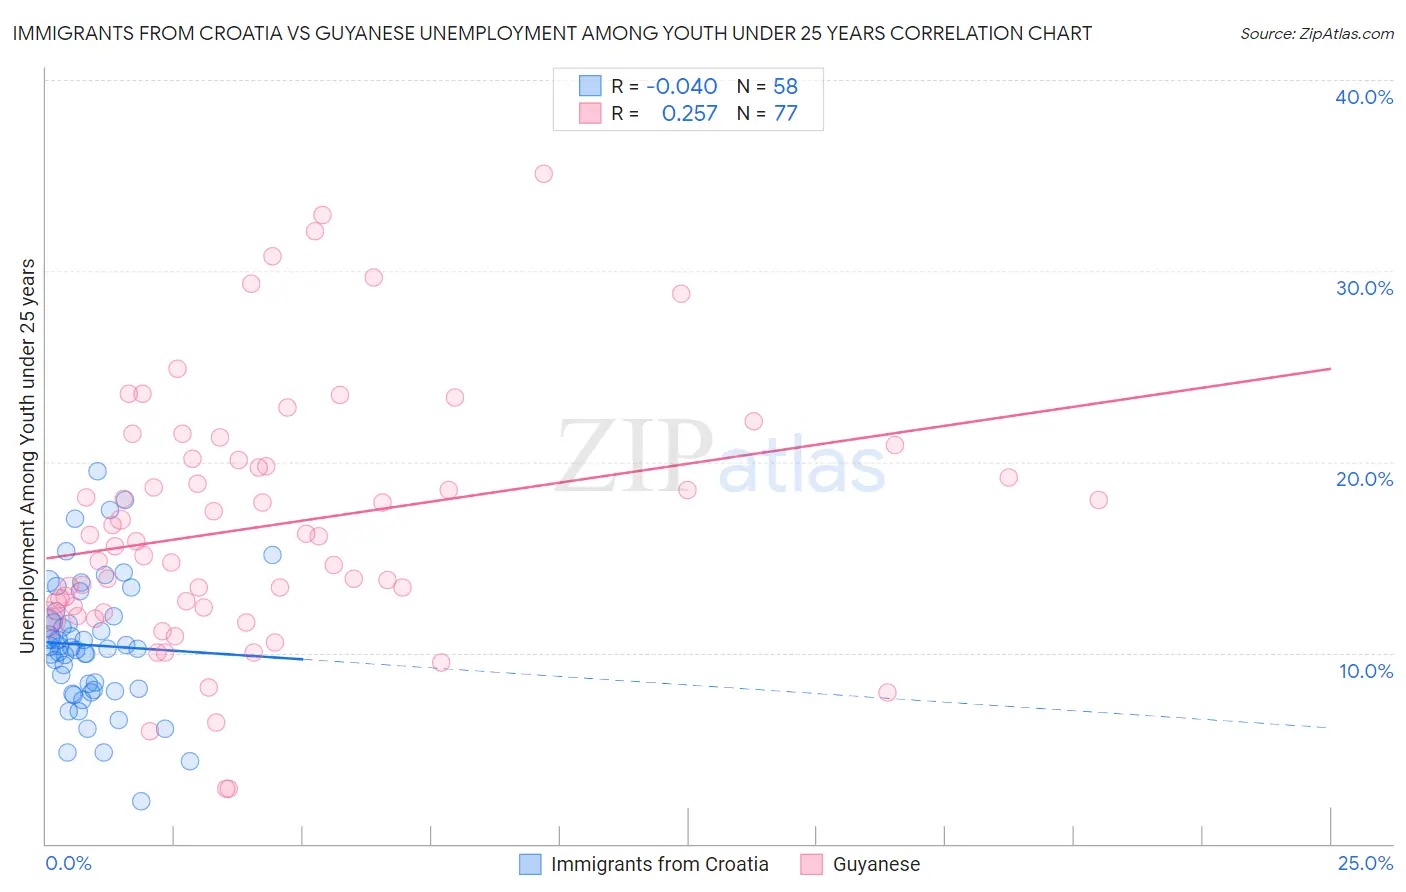
Immigrants from Croatia vs Guyanese Unemployment Among Youth under 25 years Correlation Chart

The statistical analysis conducted on geographies consisting of 132,077,248 people shows no correlation between the proportion of Immigrants from Croatia and unemployment rate among youth under the age of 25 in the United States with a correlation coefficient (R) of -0.040 and weighted average of 11.1%. Similarly, the statistical analysis conducted on geographies consisting of 176,229,123 people shows a weak positive correlation between the proportion of Guyanese and unemployment rate among youth under the age of 25 in the United States with a correlation coefficient (R) of 0.257 and weighted average of 15.9%, a difference of 42.8%.
Immigrants from Croatia vs Guyanese Unemployment Among Youth under 25 years

Unemployment Among Youth under 25 years Correlation Summary

MeasurementImmigrants from CroatiaGuyanese
Minimum2.2%2.9%
Maximum19.5%35.1%
Range17.3%32.2%
Mean10.4%16.7%
Median10.2%15.9%
Interquartile 25% (IQ1)8.1%12.3%
Interquartile 75% (IQ3)11.9%20.2%
Interquartile Range (IQR)3.9%7.9%
Standard Deviation (Sample)3.4%6.7%
Standard Deviation (Population)3.4%6.6%

Similar Demographics by Unemployment Among Youth under 25 years

Demographics Similar to Immigrants from Croatia by Unemployment Among Youth under 25 years

In terms of unemployment among youth under 25 years, the demographic groups most similar to Immigrants from Croatia are Immigrants from Netherlands (11.1%, a difference of 0.010%), Filipino (11.1%, a difference of 0.10%), Jordanian (11.1%, a difference of 0.12%), Immigrants from Singapore (11.2%, a difference of 0.18%), and Macedonian (11.2%, a difference of 0.21%).
DemographicsRating | RankUnemployment Among Youth under 25 years
Immigrants | Saudi Arabia
98.8
/100
|
#56
Exceptional
11.1%
Immigrants | Eritrea
98.8
/100
|
#57
Exceptional
11.1%
Scotch-Irish
98.8
/100
|
#58
Exceptional
11.1%
Immigrants | Eastern Africa
98.7
/100
|
#59
Exceptional
11.1%
South Africans
98.5
/100
|
#60
Exceptional
11.1%
Filipinos
98.3
/100
|
#61
Exceptional
11.1%
Immigrants | Netherlands
98.1
/100
|
#62
Exceptional
11.1%
Immigrants | Croatia
98.1
/100
|
#63
Exceptional
11.1%
Jordanians
97.9
/100
|
#64
Exceptional
11.1%
Immigrants | Singapore
97.8
/100
|
#65
Exceptional
11.2%
Macedonians
97.7
/100
|
#66
Exceptional
11.2%
Chickasaw
97.7
/100
|
#67
Exceptional
11.2%
Immigrants | Kenya
97.6
/100
|
#68
Exceptional
11.2%
Immigrants | Moldova
97.5
/100
|
#69
Exceptional
11.2%
Slavs
97.5
/100
|
#70
Exceptional
11.2%

Demographics Similar to Guyanese by Unemployment Among Youth under 25 years

In terms of unemployment among youth under 25 years, the demographic groups most similar to Guyanese are Immigrants from Guyana (15.9%, a difference of 0.25%), Immigrants from Grenada (15.8%, a difference of 0.46%), Dominican (15.7%, a difference of 1.1%), Immigrants from St. Vincent and the Grenadines (16.1%, a difference of 1.6%), and Yakama (15.6%, a difference of 2.0%).
DemographicsRating | RankUnemployment Among Youth under 25 years
Immigrants | Barbados
0.0
/100
|
#326
Tragic
15.2%
British West Indians
0.0
/100
|
#327
Tragic
15.5%
Immigrants | Dominican Republic
0.0
/100
|
#328
Tragic
15.6%
Immigrants | Yemen
0.0
/100
|
#329
Tragic
15.6%
Yakama
0.0
/100
|
#330
Tragic
15.6%
Dominicans
0.0
/100
|
#331
Tragic
15.7%
Immigrants | Grenada
0.0
/100
|
#332
Tragic
15.8%
Guyanese
0.0
/100
|
#333
Tragic
15.9%
Immigrants | Guyana
0.0
/100
|
#334
Tragic
15.9%
Immigrants | St. Vincent and the Grenadines
0.0
/100
|
#335
Tragic
16.1%
Pima
0.0
/100
|
#336
Tragic
16.2%
Arapaho
0.0
/100
|
#337
Tragic
16.3%
Yuman
0.0
/100
|
#338
Tragic
16.3%
Tsimshian
0.0
/100
|
#339
Tragic
16.5%
Colville
0.0
/100
|
#340
Tragic
16.8%