Immigrants from El Salvador vs Slovak Unemployment Among Ages 16 to 19 years
COMPARE
Immigrants from El Salvador
Slovak
Unemployment Among Ages 16 to 19 years
Unemployment Among Ages 16 to 19 years Comparison
Immigrants from El Salvador
Slovaks
19.1%
UNEMPLOYMENT AMONG AGES 16 TO 19 YEARS
0.1/ 100
METRIC RATING
268th/ 347
METRIC RANK
16.8%
UNEMPLOYMENT AMONG AGES 16 TO 19 YEARS
97.5/ 100
METRIC RATING
79th/ 347
METRIC RANK
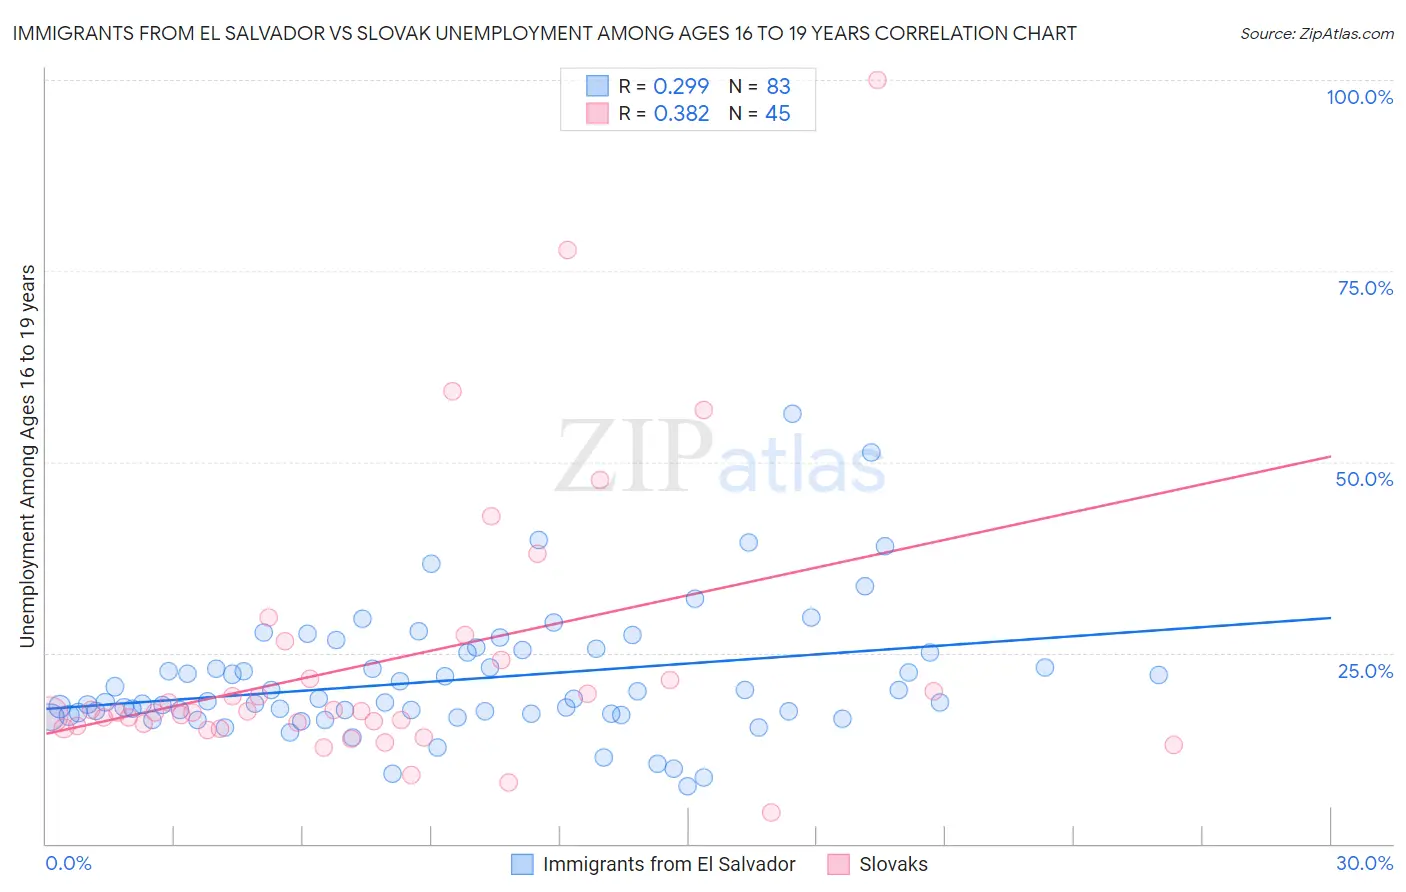
Immigrants from El Salvador vs Slovak Unemployment Among Ages 16 to 19 years Correlation Chart
The statistical analysis conducted on geographies consisting of 342,569,463 people shows a weak positive correlation between the proportion of Immigrants from El Salvador and unemployment rate among population between the ages 16 and 19 in the United States with a correlation coefficient (R) of 0.299 and weighted average of 19.1%. Similarly, the statistical analysis conducted on geographies consisting of 372,122,103 people shows a mild positive correlation between the proportion of Slovaks and unemployment rate among population between the ages 16 and 19 in the United States with a correlation coefficient (R) of 0.382 and weighted average of 16.8%, a difference of 13.6%.
Unemployment Among Ages 16 to 19 years Correlation Summary
| Measurement | Immigrants from El Salvador | Slovak |
| Minimum | 7.6% | 4.1% |
| Maximum | 56.3% | 100.0% |
| Range | 48.7% | 95.9% |
| Mean | 21.5% | 23.8% |
| Median | 18.6% | 17.2% |
| Interquartile 25% (IQ1) | 17.0% | 15.3% |
| Interquartile 75% (IQ3) | 25.1% | 22.8% |
| Interquartile Range (IQR) | 8.1% | 7.6% |
| Standard Deviation (Sample) | 8.4% | 18.3% |
| Standard Deviation (Population) | 8.3% | 18.1% |
Similar Demographics by Unemployment Among Ages 16 to 19 years
Demographics Similar to Immigrants from El Salvador by Unemployment Among Ages 16 to 19 years
In terms of unemployment among ages 16 to 19 years, the demographic groups most similar to Immigrants from El Salvador are Lumbee (19.1%, a difference of 0.080%), Honduran (19.2%, a difference of 0.26%), Israeli (19.0%, a difference of 0.28%), Immigrants from Honduras (19.0%, a difference of 0.62%), and Blackfeet (19.2%, a difference of 0.64%).
| Demographics | Rating | Rank | Unemployment Among Ages 16 to 19 years |
| Spanish American Indians | 0.1 /100 | #261 | Tragic 18.9% |
| Salvadorans | 0.1 /100 | #262 | Tragic 18.9% |
| Cree | 0.1 /100 | #263 | Tragic 19.0% |
| Yaqui | 0.1 /100 | #264 | Tragic 19.0% |
| Choctaw | 0.1 /100 | #265 | Tragic 19.0% |
| Immigrants | Honduras | 0.1 /100 | #266 | Tragic 19.0% |
| Israelis | 0.1 /100 | #267 | Tragic 19.0% |
| Immigrants | El Salvador | 0.1 /100 | #268 | Tragic 19.1% |
| Lumbee | 0.1 /100 | #269 | Tragic 19.1% |
| Hondurans | 0.1 /100 | #270 | Tragic 19.2% |
| Blackfeet | 0.0 /100 | #271 | Tragic 19.2% |
| Hispanics or Latinos | 0.0 /100 | #272 | Tragic 19.2% |
| Immigrants | Panama | 0.0 /100 | #273 | Tragic 19.3% |
| Shoshone | 0.0 /100 | #274 | Tragic 19.3% |
| Paraguayans | 0.0 /100 | #275 | Tragic 19.4% |
Demographics Similar to Slovaks by Unemployment Among Ages 16 to 19 years
In terms of unemployment among ages 16 to 19 years, the demographic groups most similar to Slovaks are French Canadian (16.8%, a difference of 0.0%), Immigrants from Latvia (16.8%, a difference of 0.0%), White/Caucasian (16.8%, a difference of 0.010%), Ugandan (16.8%, a difference of 0.030%), and French (16.8%, a difference of 0.060%).
| Demographics | Rating | Rank | Unemployment Among Ages 16 to 19 years |
| Immigrants | Canada | 98.5 /100 | #72 | Exceptional 16.7% |
| Lithuanians | 98.2 /100 | #73 | Exceptional 16.7% |
| Immigrants | Eastern Africa | 98.1 /100 | #74 | Exceptional 16.8% |
| New Zealanders | 98.0 /100 | #75 | Exceptional 16.8% |
| Immigrants | North America | 97.9 /100 | #76 | Exceptional 16.8% |
| Immigrants | Singapore | 97.8 /100 | #77 | Exceptional 16.8% |
| Soviet Union | 97.8 /100 | #78 | Exceptional 16.8% |
| Slovaks | 97.5 /100 | #79 | Exceptional 16.8% |
| French Canadians | 97.5 /100 | #80 | Exceptional 16.8% |
| Immigrants | Latvia | 97.5 /100 | #81 | Exceptional 16.8% |
| Whites/Caucasians | 97.5 /100 | #82 | Exceptional 16.8% |
| Ugandans | 97.4 /100 | #83 | Exceptional 16.8% |
| French | 97.4 /100 | #84 | Exceptional 16.8% |
| Immigrants | Kuwait | 97.2 /100 | #85 | Exceptional 16.8% |
| Immigrants | Scotland | 97.2 /100 | #86 | Exceptional 16.8% |