Taiwanese vs Central American Unemployment Among Ages 55 to 59 years
COMPARE
Taiwanese
Central American
Unemployment Among Ages 55 to 59 years
Unemployment Among Ages 55 to 59 years Comparison
Taiwanese
Central Americans
4.6%
UNEMPLOYMENT AMONG AGES 55 TO 59 YEARS
97.9/ 100
METRIC RATING
81st/ 347
METRIC RANK
5.1%
UNEMPLOYMENT AMONG AGES 55 TO 59 YEARS
0.2/ 100
METRIC RATING
257th/ 347
METRIC RANK
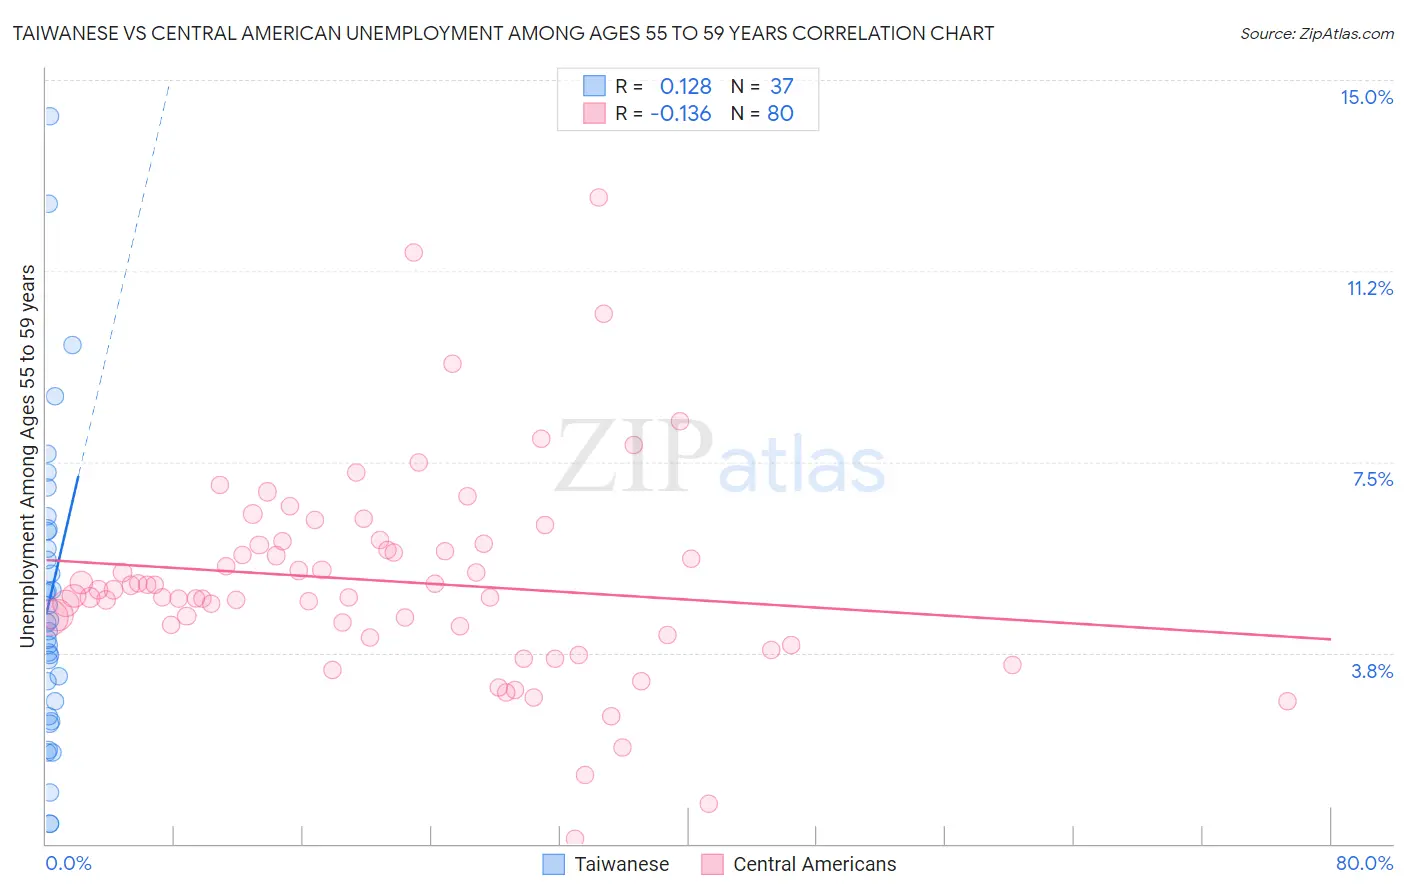
Taiwanese vs Central American Unemployment Among Ages 55 to 59 years Correlation Chart
The statistical analysis conducted on geographies consisting of 31,568,879 people shows a poor positive correlation between the proportion of Taiwanese and unemployment rate among population between the ages 55 and 59 in the United States with a correlation coefficient (R) of 0.128 and weighted average of 4.6%. Similarly, the statistical analysis conducted on geographies consisting of 452,699,572 people shows a poor negative correlation between the proportion of Central Americans and unemployment rate among population between the ages 55 and 59 in the United States with a correlation coefficient (R) of -0.136 and weighted average of 5.1%, a difference of 10.7%.
Unemployment Among Ages 55 to 59 years Correlation Summary
| Measurement | Taiwanese | Central American |
| Minimum | 0.40% | 0.10% |
| Maximum | 14.3% | 12.7% |
| Range | 13.9% | 12.6% |
| Mean | 4.8% | 5.2% |
| Median | 4.3% | 4.9% |
| Interquartile 25% (IQ1) | 2.6% | 4.2% |
| Interquartile 75% (IQ3) | 6.2% | 5.9% |
| Interquartile Range (IQR) | 3.5% | 1.7% |
| Standard Deviation (Sample) | 3.0% | 2.0% |
| Standard Deviation (Population) | 3.0% | 2.0% |
Similar Demographics by Unemployment Among Ages 55 to 59 years
Demographics Similar to Taiwanese by Unemployment Among Ages 55 to 59 years
In terms of unemployment among ages 55 to 59 years, the demographic groups most similar to Taiwanese are Latvian (4.6%, a difference of 0.050%), Cambodian (4.6%, a difference of 0.070%), Sri Lankan (4.6%, a difference of 0.11%), Lebanese (4.6%, a difference of 0.17%), and Finnish (4.6%, a difference of 0.20%).
| Demographics | Rating | Rank | Unemployment Among Ages 55 to 59 years |
| Croatians | 98.5 /100 | #74 | Exceptional 4.6% |
| Immigrants | Iraq | 98.5 /100 | #75 | Exceptional 4.6% |
| Immigrants | Bosnia and Herzegovina | 98.3 /100 | #76 | Exceptional 4.6% |
| Scotch-Irish | 98.3 /100 | #77 | Exceptional 4.6% |
| Finns | 98.2 /100 | #78 | Exceptional 4.6% |
| Sri Lankans | 98.1 /100 | #79 | Exceptional 4.6% |
| Cambodians | 98.0 /100 | #80 | Exceptional 4.6% |
| Taiwanese | 97.9 /100 | #81 | Exceptional 4.6% |
| Latvians | 97.8 /100 | #82 | Exceptional 4.6% |
| Lebanese | 97.5 /100 | #83 | Exceptional 4.6% |
| Malaysians | 96.9 /100 | #84 | Exceptional 4.7% |
| Immigrants | Vietnam | 96.9 /100 | #85 | Exceptional 4.7% |
| Immigrants | Colombia | 96.9 /100 | #86 | Exceptional 4.7% |
| Poles | 96.9 /100 | #87 | Exceptional 4.7% |
| Immigrants | Cameroon | 96.9 /100 | #88 | Exceptional 4.7% |
Demographics Similar to Central Americans by Unemployment Among Ages 55 to 59 years
In terms of unemployment among ages 55 to 59 years, the demographic groups most similar to Central Americans are Salvadoran (5.1%, a difference of 0.010%), Immigrants from West Indies (5.1%, a difference of 0.10%), Immigrants from Western Africa (5.1%, a difference of 0.21%), Senegalese (5.1%, a difference of 0.27%), and African (5.1%, a difference of 0.31%).
| Demographics | Rating | Rank | Unemployment Among Ages 55 to 59 years |
| Cheyenne | 0.4 /100 | #250 | Tragic 5.1% |
| Portuguese | 0.3 /100 | #251 | Tragic 5.1% |
| U.S. Virgin Islanders | 0.3 /100 | #252 | Tragic 5.1% |
| Paraguayans | 0.3 /100 | #253 | Tragic 5.1% |
| Seminole | 0.3 /100 | #254 | Tragic 5.1% |
| Blackfeet | 0.3 /100 | #255 | Tragic 5.1% |
| Senegalese | 0.3 /100 | #256 | Tragic 5.1% |
| Central Americans | 0.2 /100 | #257 | Tragic 5.1% |
| Salvadorans | 0.2 /100 | #258 | Tragic 5.1% |
| Immigrants | West Indies | 0.2 /100 | #259 | Tragic 5.1% |
| Immigrants | Western Africa | 0.2 /100 | #260 | Tragic 5.1% |
| Africans | 0.1 /100 | #261 | Tragic 5.1% |
| Immigrants | El Salvador | 0.1 /100 | #262 | Tragic 5.1% |
| Immigrants | Sierra Leone | 0.1 /100 | #263 | Tragic 5.2% |
| Immigrants | Caribbean | 0.1 /100 | #264 | Tragic 5.2% |